
Size of this preview:
800 × 591 pixels. Other resolutions:
320 × 236 pixels |
640 × 473 pixels |
1,024 × 756 pixels |
1,280 × 945 pixels |
1,835 × 1,355 pixels.
Original file (1,835 × 1,355 pixels, file size: 818 KB, MIME type: image/jpeg)
| This is a file from the
Wikimedia Commons. Information from its
description page there is shown below. Commons is a freely licensed media file repository. You can help. |
Summary
| Description |
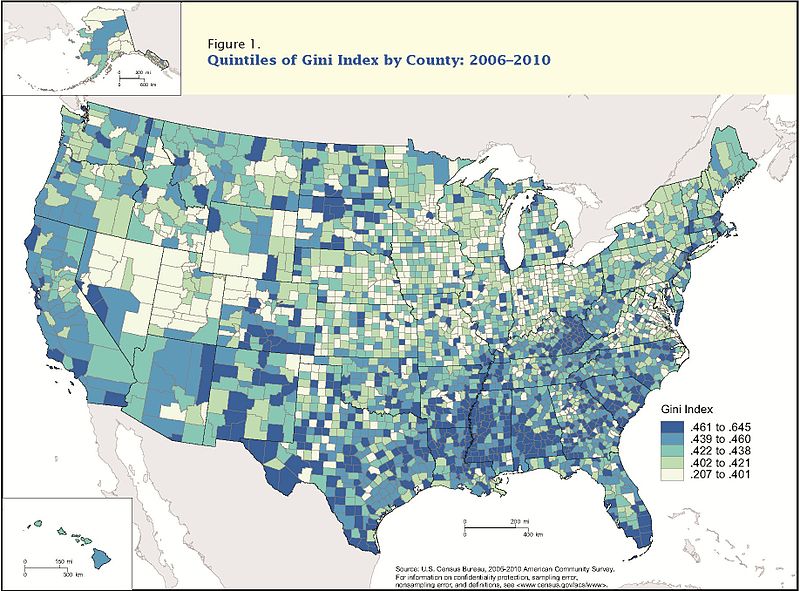
English: This map shows the Gini Index distribution by County for 2006-2010.
According to US Census Bureau, the map illustrates each county’s level of income inequality, as measured by the Gini index. The 5-year 2006–2010 Gini index for the United States as a whole was 0.467. County-level Gini indexes ranged from 0.645 to 0.207. For the full report, see: https://www.census.gov\/newsroom/releases/archives/income_wealth/cb12-tps11.html |
| Date | |
| Source | US Census Bureau (U.S. Department of Commerce) |
| Author | Adam Bee |
Licensing
This work is in the
public domain in the United States because it is a
work prepared by an officer or employee of the United States Government as part of that person’s official duties under the terms of
Title 17, Chapter 1, Section 105 of the
US Code.
Note: This only applies to original works of the Federal Government and not to the work of any individual
U.S. state,
territory, commonwealth, county, municipality, or any other subdivision. This template also does not apply to postage stamp designs published by the
United States Postal Service
since 1978. (See §
313.6(C)(1) of Compendium of U.S. Copyright Office Practices). It also does not apply to certain US coins; see
The US Mint Terms of Use.
|
 | |
| This file has been identified as being free of known restrictions under copyright law, including all related and neighboring rights. | ||
File history
Click on a date/time to view the file as it appeared at that time.
| Date/Time | Thumbnail | Dimensions | User | Comment | |
|---|---|---|---|---|---|
| current | 16:20, 30 July 2012 |
| 1,835 × 1,355 (818 KB) | ApostleVonColorado |
File usage
The following pages on the English Wikipedia use this file (pages on other projects are not listed):