Size of this preview:
680 × 599 pixels. Other resolutions:
272 × 240 pixels |
545 × 480 pixels |
871 × 768 pixels |
1,162 × 1,024 pixels |
1,425 × 1,256 pixels.
Original file (1,425 × 1,256 pixels, file size: 116 KB, MIME type: image/png)
| This is a file from the
Wikimedia Commons. Information from its
description page there is shown below. Commons is a freely licensed media file repository. You can help. |
Summary
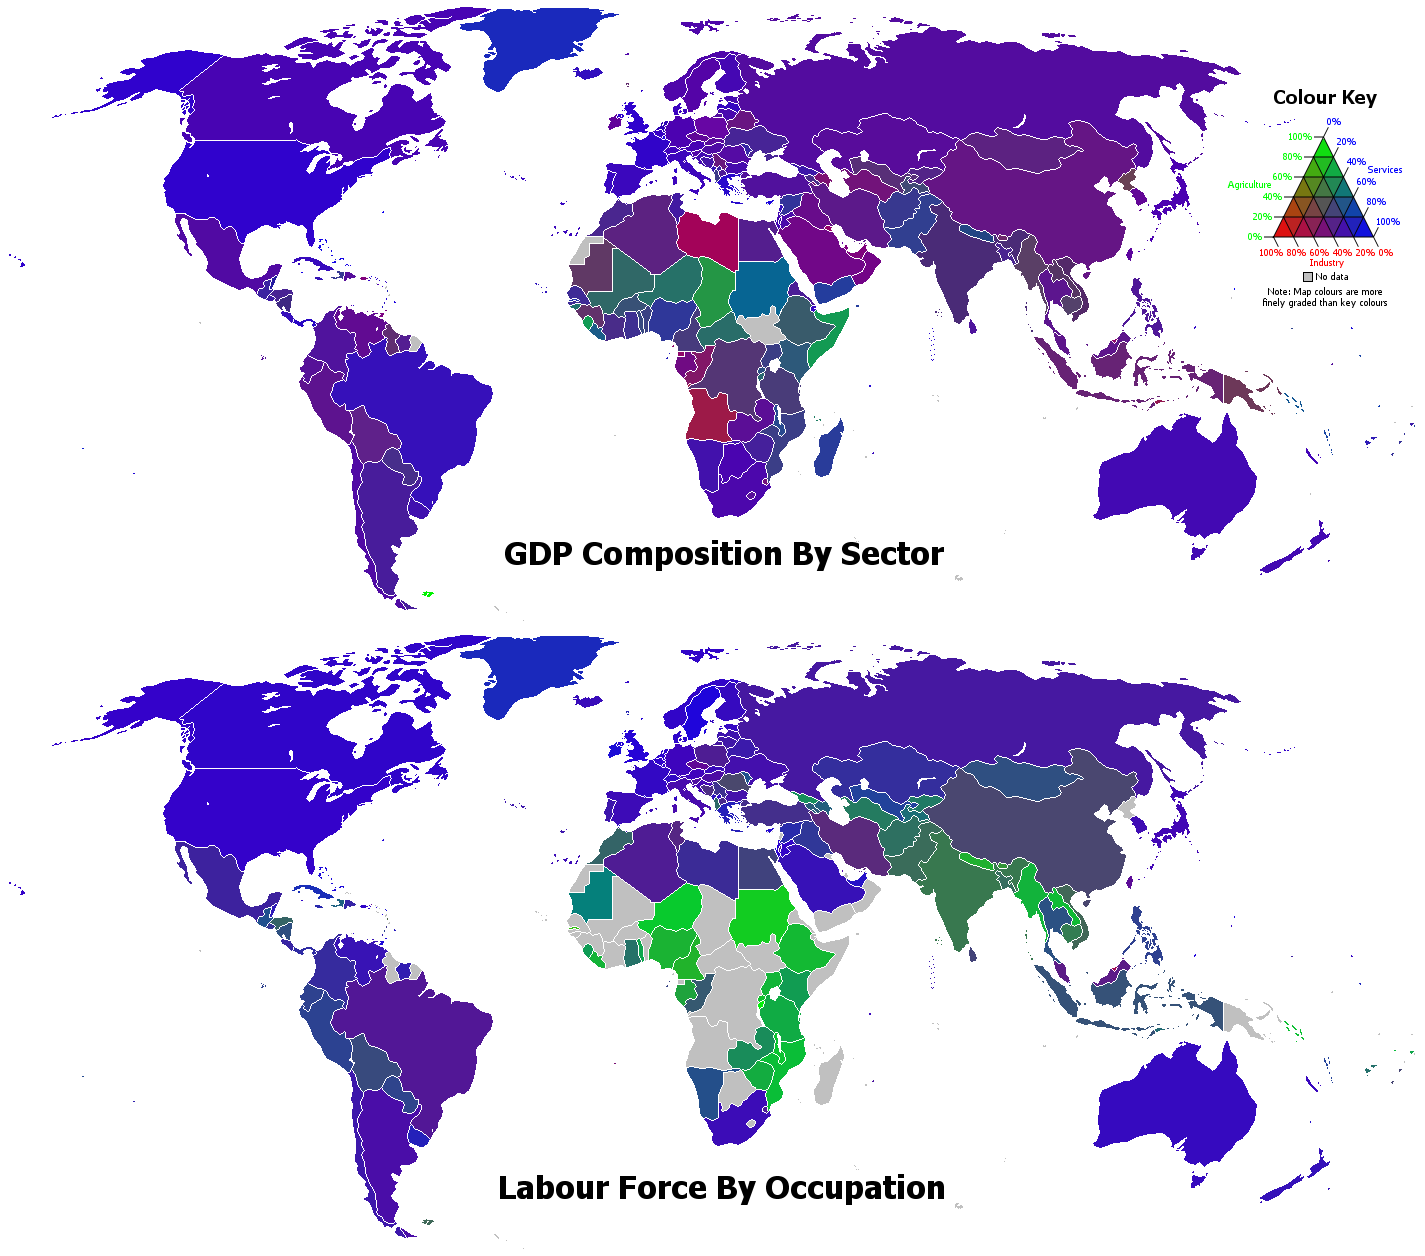
| Description | GDP Composition By Sector and Labour Force By Occupation, produced using data from the CIA World Factbook 2006. The green, red, and blue components of the colors of the countries represent the percentages for the agriculture, industry, and services sectors respectively, as summarized on the color key - for example, rgb(102,51,201) represents 20% agriculture, 40% industry, and 40% services. |
| Date | UTC |
| Source | Own work |
| Author | Safalra (Stephen Morley) |
Licensing
| I, the copyright holder of this work, release this work into the
public domain. This applies worldwide. In some countries this may not be legally possible; if so: I grant anyone the right to use this work for any purpose, without any conditions, unless such conditions are required by law. |
File history
Click on a date/time to view the file as it appeared at that time.
| Date/Time | Thumbnail | Dimensions | User | Comment | |
|---|---|---|---|---|---|
| current | 02:21, 30 October 2018 |
| 1,425 × 1,256 (116 KB) | Ketrit | Minor fixes |
| 01:38, 30 October 2018 |
 | 1,425 × 1,256 (116 KB) | Ketrit | Updated for 2018. | |
| 15:27, 18 September 2006 |
 | 1,357 × 1,256 (90 KB) | Safalra | {{Information |Description = GDP Composition By Sector and Labour Force By Occupation, produced using data from the CIA World Factbook 2006. The green, red, and blue components of the colours of the countries represent the percentages for the agriculture, | |
| 15:21, 18 September 2006 |
 | 1,357 × 1,256 (90 KB) | Safalra | == Summary == {{Information |Description = GDP Composition By Sector and Labour Force By Occupation, produced using data from the CIA World Factbook 2006. The green, red, and blue components of the colours of the countries represent the percentages for th |
File usage
The following pages on the English Wikipedia use this file (pages on other projects are not listed):
Global file usage
The following other wikis use this file:
- Usage on ar.wikipedia.org
- Usage on br.wikipedia.org
- Usage on ca.wikipedia.org
- Usage on ceb.wikipedia.org
- Usage on ckb.wikipedia.org
- Usage on co.wikipedia.org
- Usage on crh.wikipedia.org
- Usage on cs.wikipedia.org
- Usage on da.wikipedia.org
- Usage on el.wikipedia.org
- Usage on fa.wikipedia.org
- Usage on fr.wikipedia.org
- Usage on hi.wikipedia.org
- Usage on hu.wikipedia.org
- Usage on hy.wikipedia.org
- Usage on it.wikipedia.org
- Usage on it.wikibooks.org
- Usage on ja.wikipedia.org
- Usage on kk.wikipedia.org
- Usage on ko.wikipedia.org
- Usage on lez.wikipedia.org
- Usage on lo.wikipedia.org
- Usage on lt.wikipedia.org
- Usage on mk.wikipedia.org
- Usage on ml.wikipedia.org
- Usage on my.wikipedia.org
- Usage on ne.wikipedia.org
- Usage on new.wikipedia.org
- Usage on pa.wikipedia.org
- Usage on ps.wikipedia.org
- Usage on pt.wikipedia.org
- Usage on ru.wikipedia.org
- Usage on sl.wikipedia.org
- Usage on sr.wikipedia.org
- Usage on sr.wikiquote.org
- Usage on te.wikipedia.org
- Usage on tr.wikipedia.org
- Usage on tt.wikipedia.org
- Usage on uk.wikipedia.org
- Usage on vec.wikipedia.org
- Usage on vi.wikipedia.org
- Usage on www.wikidata.org
- Usage on zh-min-nan.wikipedia.org
- Usage on zh.wikipedia.org