
Size of this PNG preview of this SVG file:
600 × 600 pixels. Other resolutions:
240 × 240 pixels |
480 × 480 pixels |
768 × 768 pixels |
1,024 × 1,024 pixels |
2,048 × 2,048 pixels |
3,200 × 3,200 pixels.
Original file (SVG file, nominally 3,200 × 3,200 pixels, file size: 2.13 MB)
| This is a file from the
Wikimedia Commons. Information from its
description page there is shown below. Commons is a freely licensed media file repository. You can help. |
Summary
| Description |
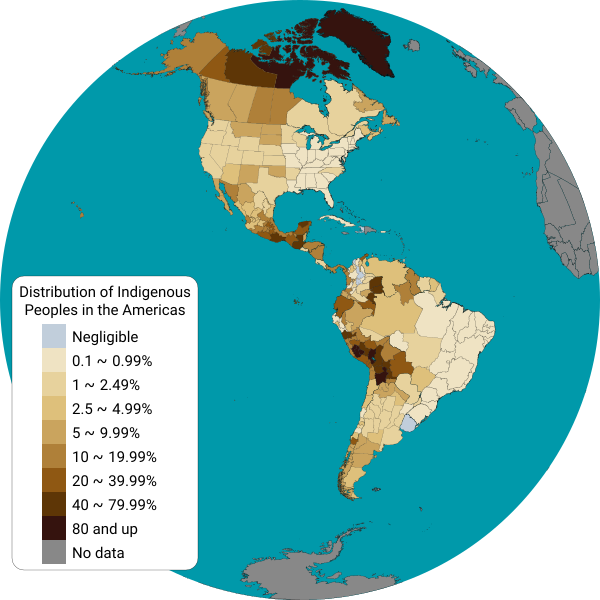
English: This map displays the distribution of indigenous people from each country in the Americas. Detailed information is displayed for Canadian provinces, U.S. states, Mexican states, Brazilian states and Chilean regions.
Map shapes from Natural Earth data, projected into a Lambert Azimuthal Equal-Area projection using a Python script. Data sources:
Español: Este mapa muestra el porcentaje de población indígena por cada país de América. Se muestra información detallada para las provincias de Canadá, los estados de los Estados Unidos, los estados de México, los estados de Brasil, los departamentos del Perú y de Bolivia, las provincias de la Argentina, y las regiones de Chile. |
| Date | |
| Source | Own work |
| Author | Locoluis |
Licensing
I, the copyright holder of this work, hereby publish it under the following license:
This file is licensed under the
Creative Commons
Attribution-Share Alike 4.0 International license.
- You are free:
- to share – to copy, distribute and transmit the work
- to remix – to adapt the work
- Under the following conditions:
- attribution – You must give appropriate credit, provide a link to the license, and indicate if changes were made. You may do so in any reasonable manner, but not in any way that suggests the licensor endorses you or your use.
- share alike – If you remix, transform, or build upon the material, you must distribute your contributions under the same or compatible license as the original.
File history
Click on a date/time to view the file as it appeared at that time.
| Date/Time | Thumbnail | Dimensions | User | Comment | |
|---|---|---|---|---|---|
| current | 02:03, 7 June 2022 |
| 3,200 × 3,200 (2.13 MB) | DemonDays64 | Converted text to Roboto path for consistent display. Also deleted the NOR path and removed some of the tiny dots of islands from NW Hawaii -- more border than anything and the NOR object was right on the edge making it look weird |
| 16:34, 16 September 2021 |
 | 3,200 × 3,200 (2.07 MB) | Abbasi786786 | 2020 US Census Update | |
| 18:53, 8 July 2017 |
 | 3,200 × 3,200 (6.58 MB) | Locoluis | Colombia https://www.dane.gov.co/files/censo2005/etnia/sys/visibilidad_estadistica_etnicos.pdf | |
| 06:06, 2 May 2016 |
 | 1,600 × 1,600 (6.4 MB) | Locoluis | Argentina | |
| 02:45, 14 March 2016 |
 | 1,600 × 1,600 (6.4 MB) | Locoluis | Added data for Peru and Bolivia | |
| 05:38, 29 March 2015 |
 | 1,600 × 1,600 (6.4 MB) | Locoluis | Broke Antarctica in the process... | |
| 04:56, 29 March 2015 |
 | 1,600 × 1,600 (6.52 MB) | Locoluis | * Fixed Canada * Added lakes * Added Brazil data from http://www.ibge.gov.br/indigenas/indigena_censo2010.pdf * Added another color category. | |
| 01:50, 29 March 2015 |
 | 1,600 × 1,600 (3.37 MB) | Locoluis | French Guiana, simplified redundant points, color scheme. | |
| 01:07, 29 March 2015 |
 | 1,600 × 1,600 (8.43 MB) | Locoluis | There was a CSS rule that displayed all US, CA, MX and CA regional polygons after all others were hidden. It didn't work. | |
| 01:02, 29 March 2015 |
 | 1,600 × 1,600 (8.43 MB) | Locoluis | Oops... |
File usage
The following pages on the English Wikipedia use this file (pages on other projects are not listed):
Global file usage
The following other wikis use this file:
- Usage on ar.wikipedia.org
- Usage on ast.wikipedia.org
- Usage on be.wikipedia.org
- Usage on bg.wikipedia.org
- Usage on ca.wikipedia.org
- Usage on cs.wikipedia.org
- Usage on de.wikipedia.org
- Usage on eo.wikipedia.org
- Usage on et.wikipedia.org
- Usage on fi.wikipedia.org
- Usage on fr.wikipedia.org
- Usage on fy.wikipedia.org
- Usage on ga.wikipedia.org
- Usage on he.wikipedia.org
- Usage on ia.wikipedia.org
- Usage on id.wikipedia.org
- Usage on ja.wikipedia.org
- Usage on ko.wikipedia.org
- Usage on ky.wikipedia.org
- Usage on mk.wikipedia.org
- Usage on oc.wikipedia.org
- Usage on pt.wikipedia.org
- Usage on ro.wikipedia.org
- Usage on rue.wikipedia.org
- Usage on sr.wikipedia.org
- Usage on szy.wikipedia.org
- Usage on tr.wikipedia.org
- Usage on vec.wikipedia.org
- Usage on vi.wikipedia.org
- Usage on www.wikidata.org
- Usage on zh.wikipedia.org