
Size of this PNG preview of this SVG file:
614 × 470 pixels. Other resolutions:
314 × 240 pixels |
627 × 480 pixels |
1,003 × 768 pixels |
1,280 × 980 pixels |
2,560 × 1,960 pixels.
Original file (SVG file, nominally 614 × 470 pixels, file size: 10 KB)
| This is a file from the
Wikimedia Commons. Information from its
description page there is shown below. Commons is a freely licensed media file repository. You can help. |
Summary
| Description |
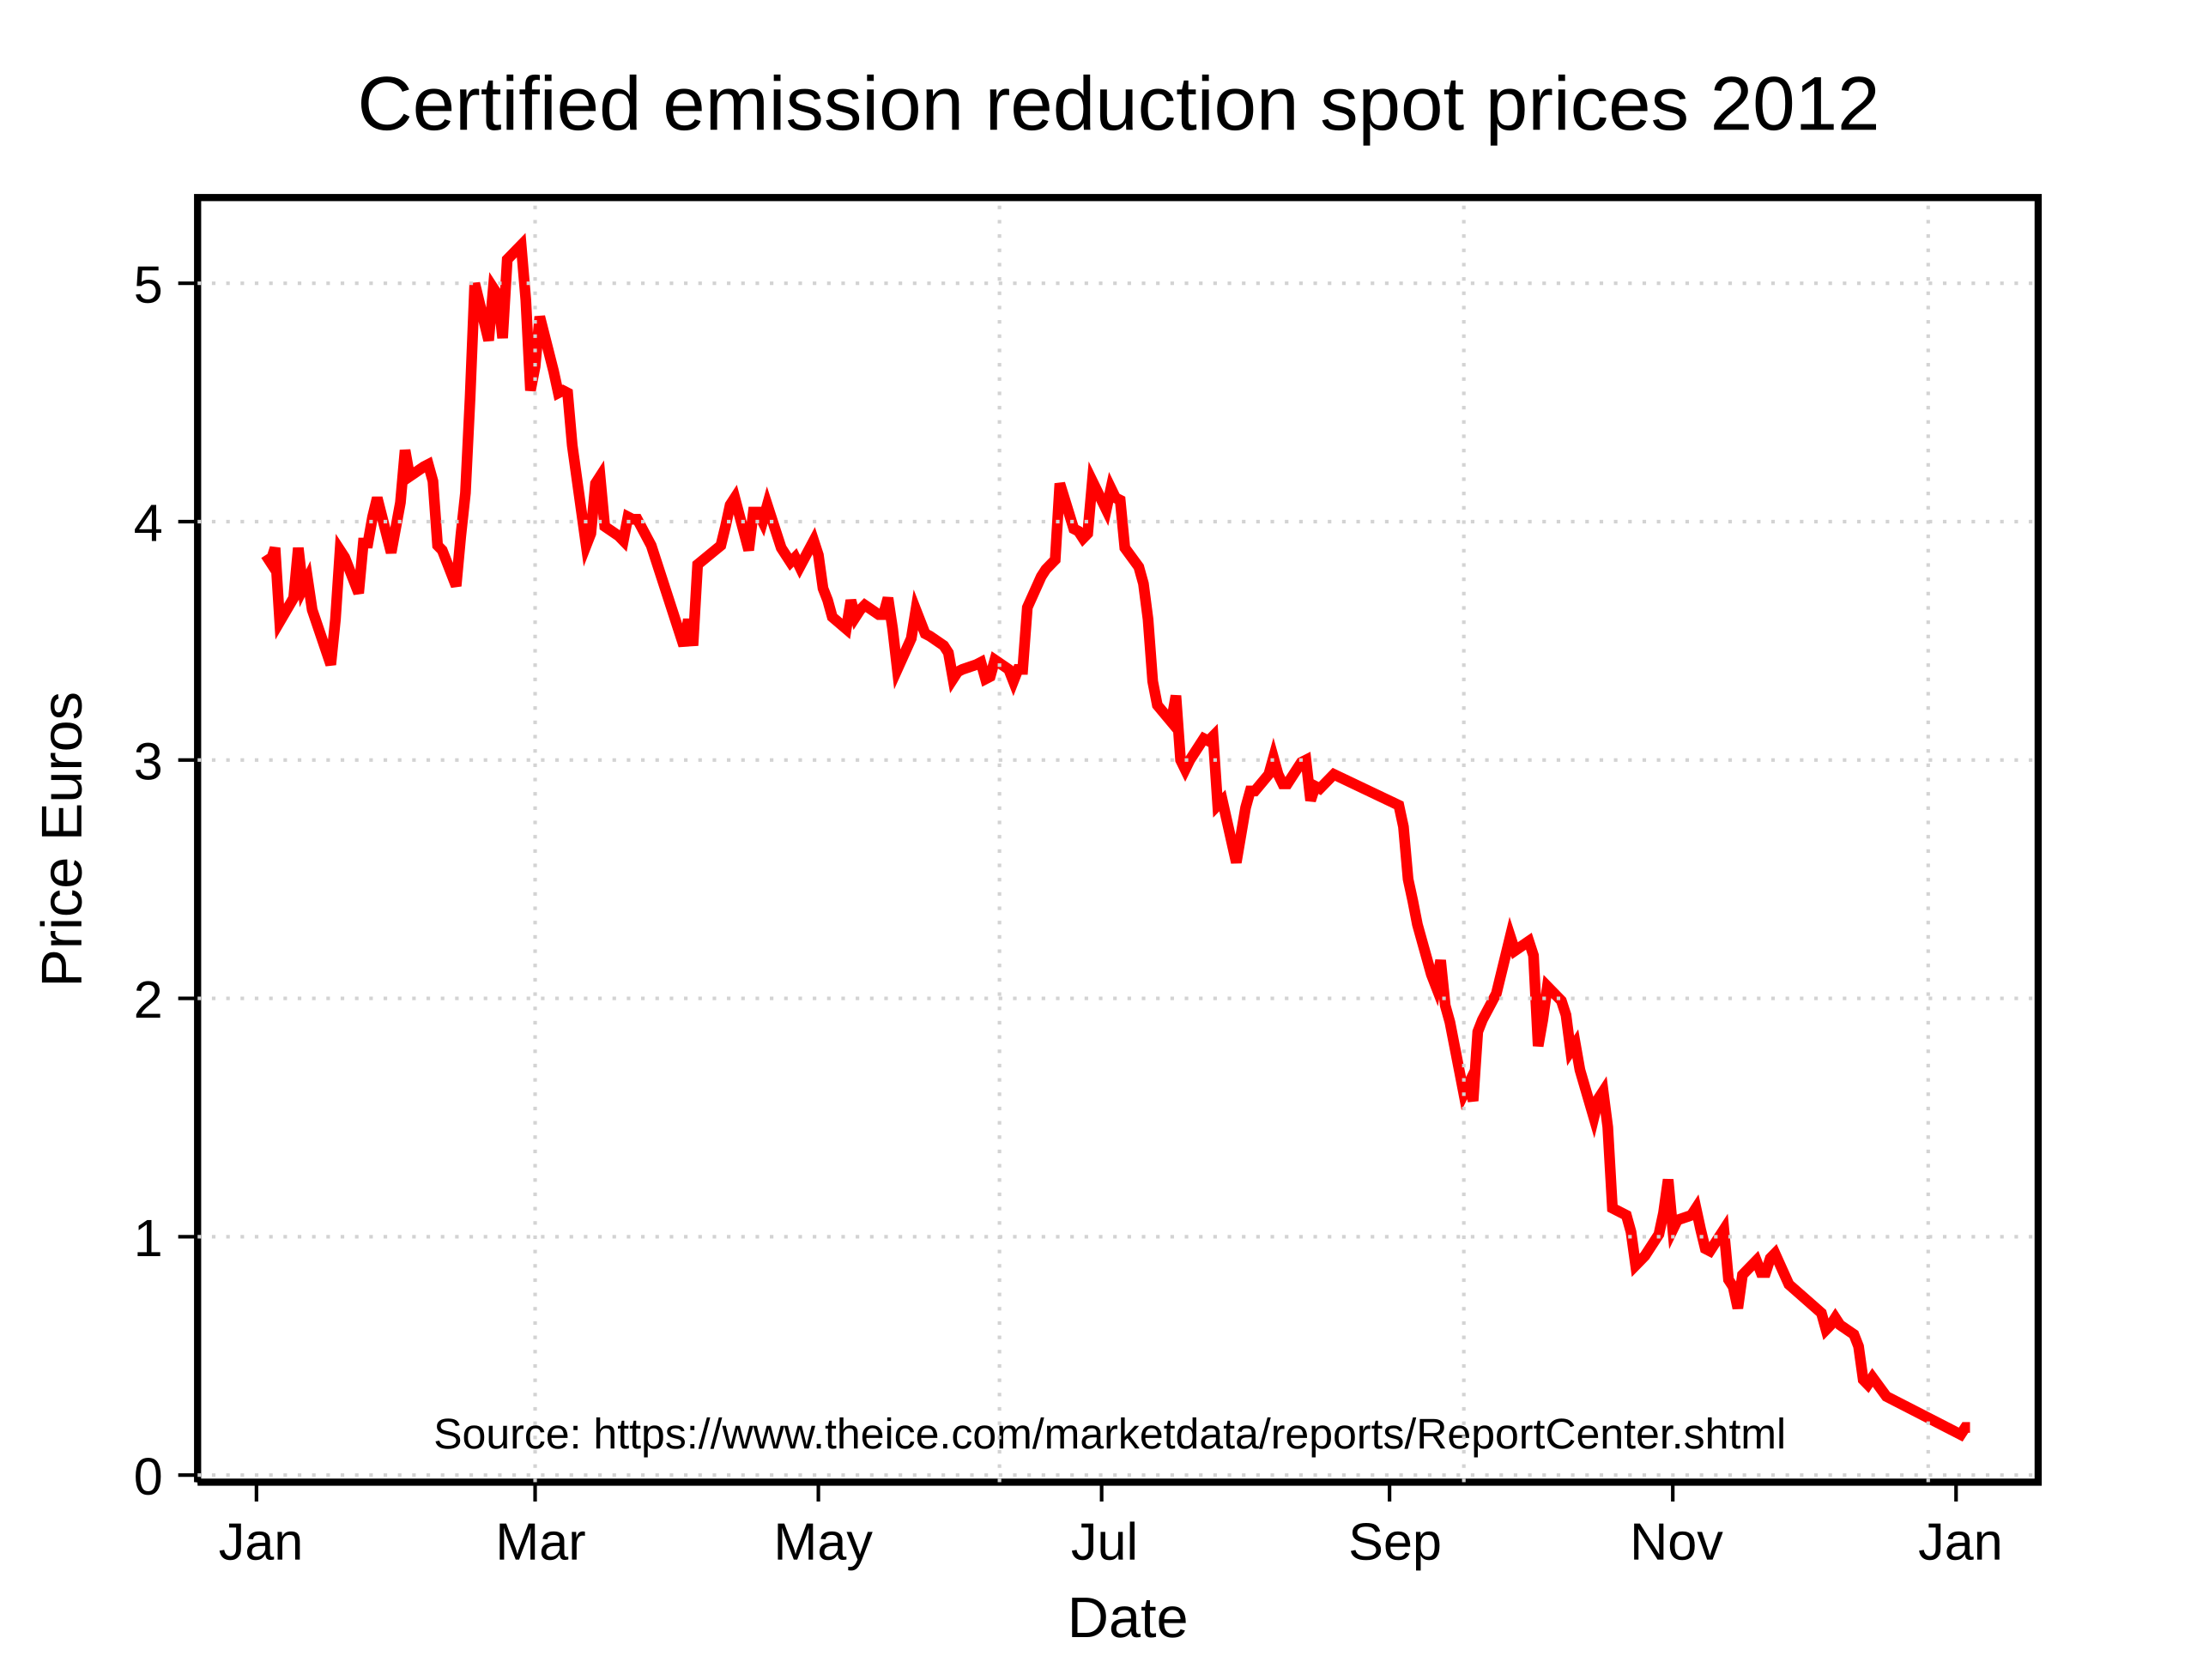
English: Certified emission reduction units (CERs) monthly spot prices 2012. Data was obtained from
https://www.theice.com/marketdata/reports/ReportCenter.shtml and a copy is saved to
https://docs.google.com/file/d/0B8LhMBA3NXL4ZUw2UGZiZXIweWM/edit
Français : Prix (comptant) mensuels des unités certifiées de réduction d'émissions de gaz à effet de serre (URCE) 2012. |
| Date | |
| Source | Own work |
| Author | Mrfebruary |
| SVG development | |
| Source code | R code#Data obtained from https://www.theice.com/marketdata/reports/ReportCenter.shtml
#and saved to https://docs.google.com/file/d/0B8LhMBA3NXL4ZUw2UGZiZXIweWM/edit
#Download to your R working directory
c <- read.csv("ice-ecr-cers-price.csv",skip=1, header=TRUE, sep=",", na.strings="NA", dec=".", strip.white=TRUE)
#str(c)
'data.frame': 1295 obs. of 5 variables:
$ Date : Factor w/ 259 levels "2011/12/30","2012/01/03",..: 1 1 1 1 1 2 2 2 2 2 ...
$ Spot : Factor w/ 259 levels "2011/12/30","2012/01/03",..: 1 1 1 1 1 2 2 2 2 2 ...
$ Strip : Factor w/ 17 levels "Apr12","Aug12",..: 3 4 5 6 9 3 4 5 6 9 ...
$ Price : num 4.16 5.01 5.28 5.56 4.21 3.93 4.79 4.93 5.23 3.86 ...
$ monthinadvance: int 12 24 36 48 1 11 23 35 47 0 ...
spot<-c(c[c$monthinadvance<1,])
library("RSVGTipsDevice")
devSVGTips(file="cers-spot-prices-2012.svg",toolTipMode=0,width=8.5,height=6.5)
par(mar=c(5,5,5,4)+0.1,cex.main=1.5,cex.lab=1)
with(spot,plot(Date,Price,las=1,type='l',cex.lab=1.2,lwd=3,ylab="Price Euros",col='2'))
title(cex.main=1.6,cex.lab=1,main="Certified emission reduction spot prices 2012",xlab="Date")
mtext(side=1,cex=0.9,line=-1.5,"Source: https://www.theice.com/marketdata/reports/ReportCenter.shtml")
box(lwd=2)
grid()
dev.off()
|
Licensing
I, the copyright holder of this work, hereby publish it under the following license:
This file is licensed under the
Creative Commons
Attribution-Share Alike 3.0 Unported license.
- You are free:
- to share – to copy, distribute and transmit the work
- to remix – to adapt the work
- Under the following conditions:
- attribution – You must give appropriate credit, provide a link to the license, and indicate if changes were made. You may do so in any reasonable manner, but not in any way that suggests the licensor endorses you or your use.
- share alike – If you remix, transform, or build upon the material, you must distribute your contributions under the same or compatible license as the original.
File history
Click on a date/time to view the file as it appeared at that time.
| Date/Time | Thumbnail | Dimensions | User | Comment | |
|---|---|---|---|---|---|
| current | 23:56, 29 January 2013 |
| 614 × 470 (10 KB) | Mrfebruary | User created page with UploadWizard |
File usage
The following pages on the English Wikipedia use this file (pages on other projects are not listed):
Global file usage
The following other wikis use this file:
- Usage on ar.wikipedia.org
- Usage on es.wikipedia.org
- Usage on fa.wikipedia.org