Size of this PNG preview of this SVG file:
705 × 599 pixels. Other resolutions:
282 × 240 pixels |
565 × 480 pixels |
904 × 768 pixels |
1,205 × 1,024 pixels |
2,409 × 2,048 pixels |
1,000 × 850 pixels.
Original file (SVG file, nominally 1,000 × 850 pixels, file size: 237 KB)
File history
Click on a date/time to view the file as it appeared at that time.
| Date/Time | Thumbnail | Dimensions | User | Comment | |
|---|---|---|---|---|---|
| current | 13:58, 18 May 2022 |
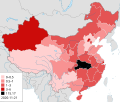
 | 1,000 × 850 (237 KB) | CaradhrasAiguo | 17 May update: Jiangxi > 2.5, Sichuan > 1 per 2019 estimates |
| 02:32, 18 April 2022 |
 | 1,000 × 850 (233 KB) | CaradhrasAiguo | update 17 Apr; Shanghai > 100, Fujian > 5, Hainan & Guangdong > 2.5, Qinghai > 1 (on 2019 estimates) | |
| 00:03, 31 March 2022 |
 | 1,000 × 850 (201 KB) | CaradhrasAiguo | missed part of Yibin and Panzhihua (Sichuan) | |
| 23:55, 30 March 2022 |
 | 1,000 × 850 (197 KB) | CaradhrasAiguo | exclude repatriated or imported cases per original intent of creator | |
| 03:59, 27 March 2022 |
 | 1,000 × 850 (113 KB) | TheNavigatrr | Updated for Jilin outbreak, and changed scale to reflect that. | |
| 06:49, 7 September 2021 |
 | 1,000 × 850 (112 KB) | Key towel | updated nearly year old data | |
| 11:29, 15 March 2021 |
 | 1,000 × 850 (112 KB) | S.S.Exp.Hashimoto | Reverted to version as of 01:38, 22 November 2020 (UTC) | |
| 05:46, 11 February 2021 |
 | 512 × 435 (109 KB) | Ken418 | 标记中国的争议地区 | |
| 01:38, 22 November 2020 |
 | 1,000 × 850 (112 KB) | TheNavigatrr | Updated for the most recent figures. The higher rates in Shanghai are repatriations | |
| 16:24, 3 October 2020 |
 | 1,000 × 850 (111 KB) | BoyuZhang1998 | Update 10-03: actually changed the ratio |
File usage
The following pages on the English Wikipedia use this file (pages on other projects are not listed):
Global file usage
The following other wikis use this file:
- Usage on ar.wikipedia.org
- Usage on de.wikipedia.org
- Usage on fi.wikipedia.org
- Usage on it.wikipedia.org
- Usage on ja.wikipedia.org
- Usage on jv.wikipedia.org
- Usage on ko.wikipedia.org
- Usage on ml.wikipedia.org
- Usage on ms.wikipedia.org
- Usage on sq.wikipedia.org
- Usage on ta.wikipedia.org
- Usage on tr.wikipedia.org
- Usage on ur.wikipedia.org
- Usage on uz.wikipedia.org
- Usage on vi.wikipedia.org
- Usage on zh.wikipedia.org