
Original file (SVG file, nominally 1,108 × 514 pixels, file size: 14 KB)
| This is a file from the
Wikimedia Commons. Information from its
description page there is shown below. Commons is a freely licensed media file repository. You can help. |
Summary
| Description |
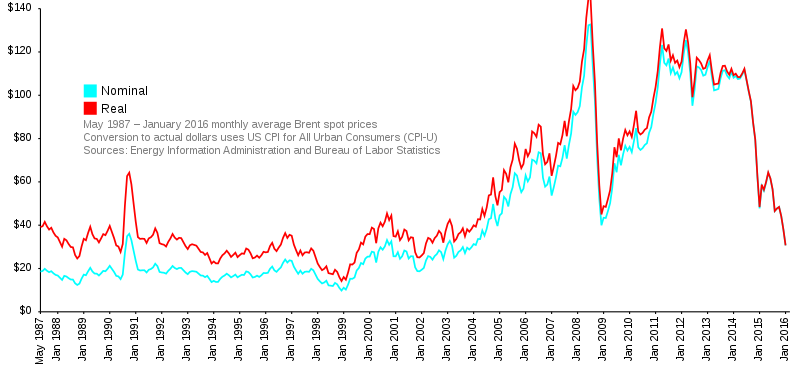
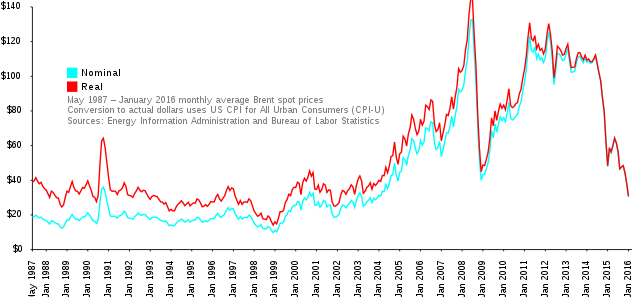
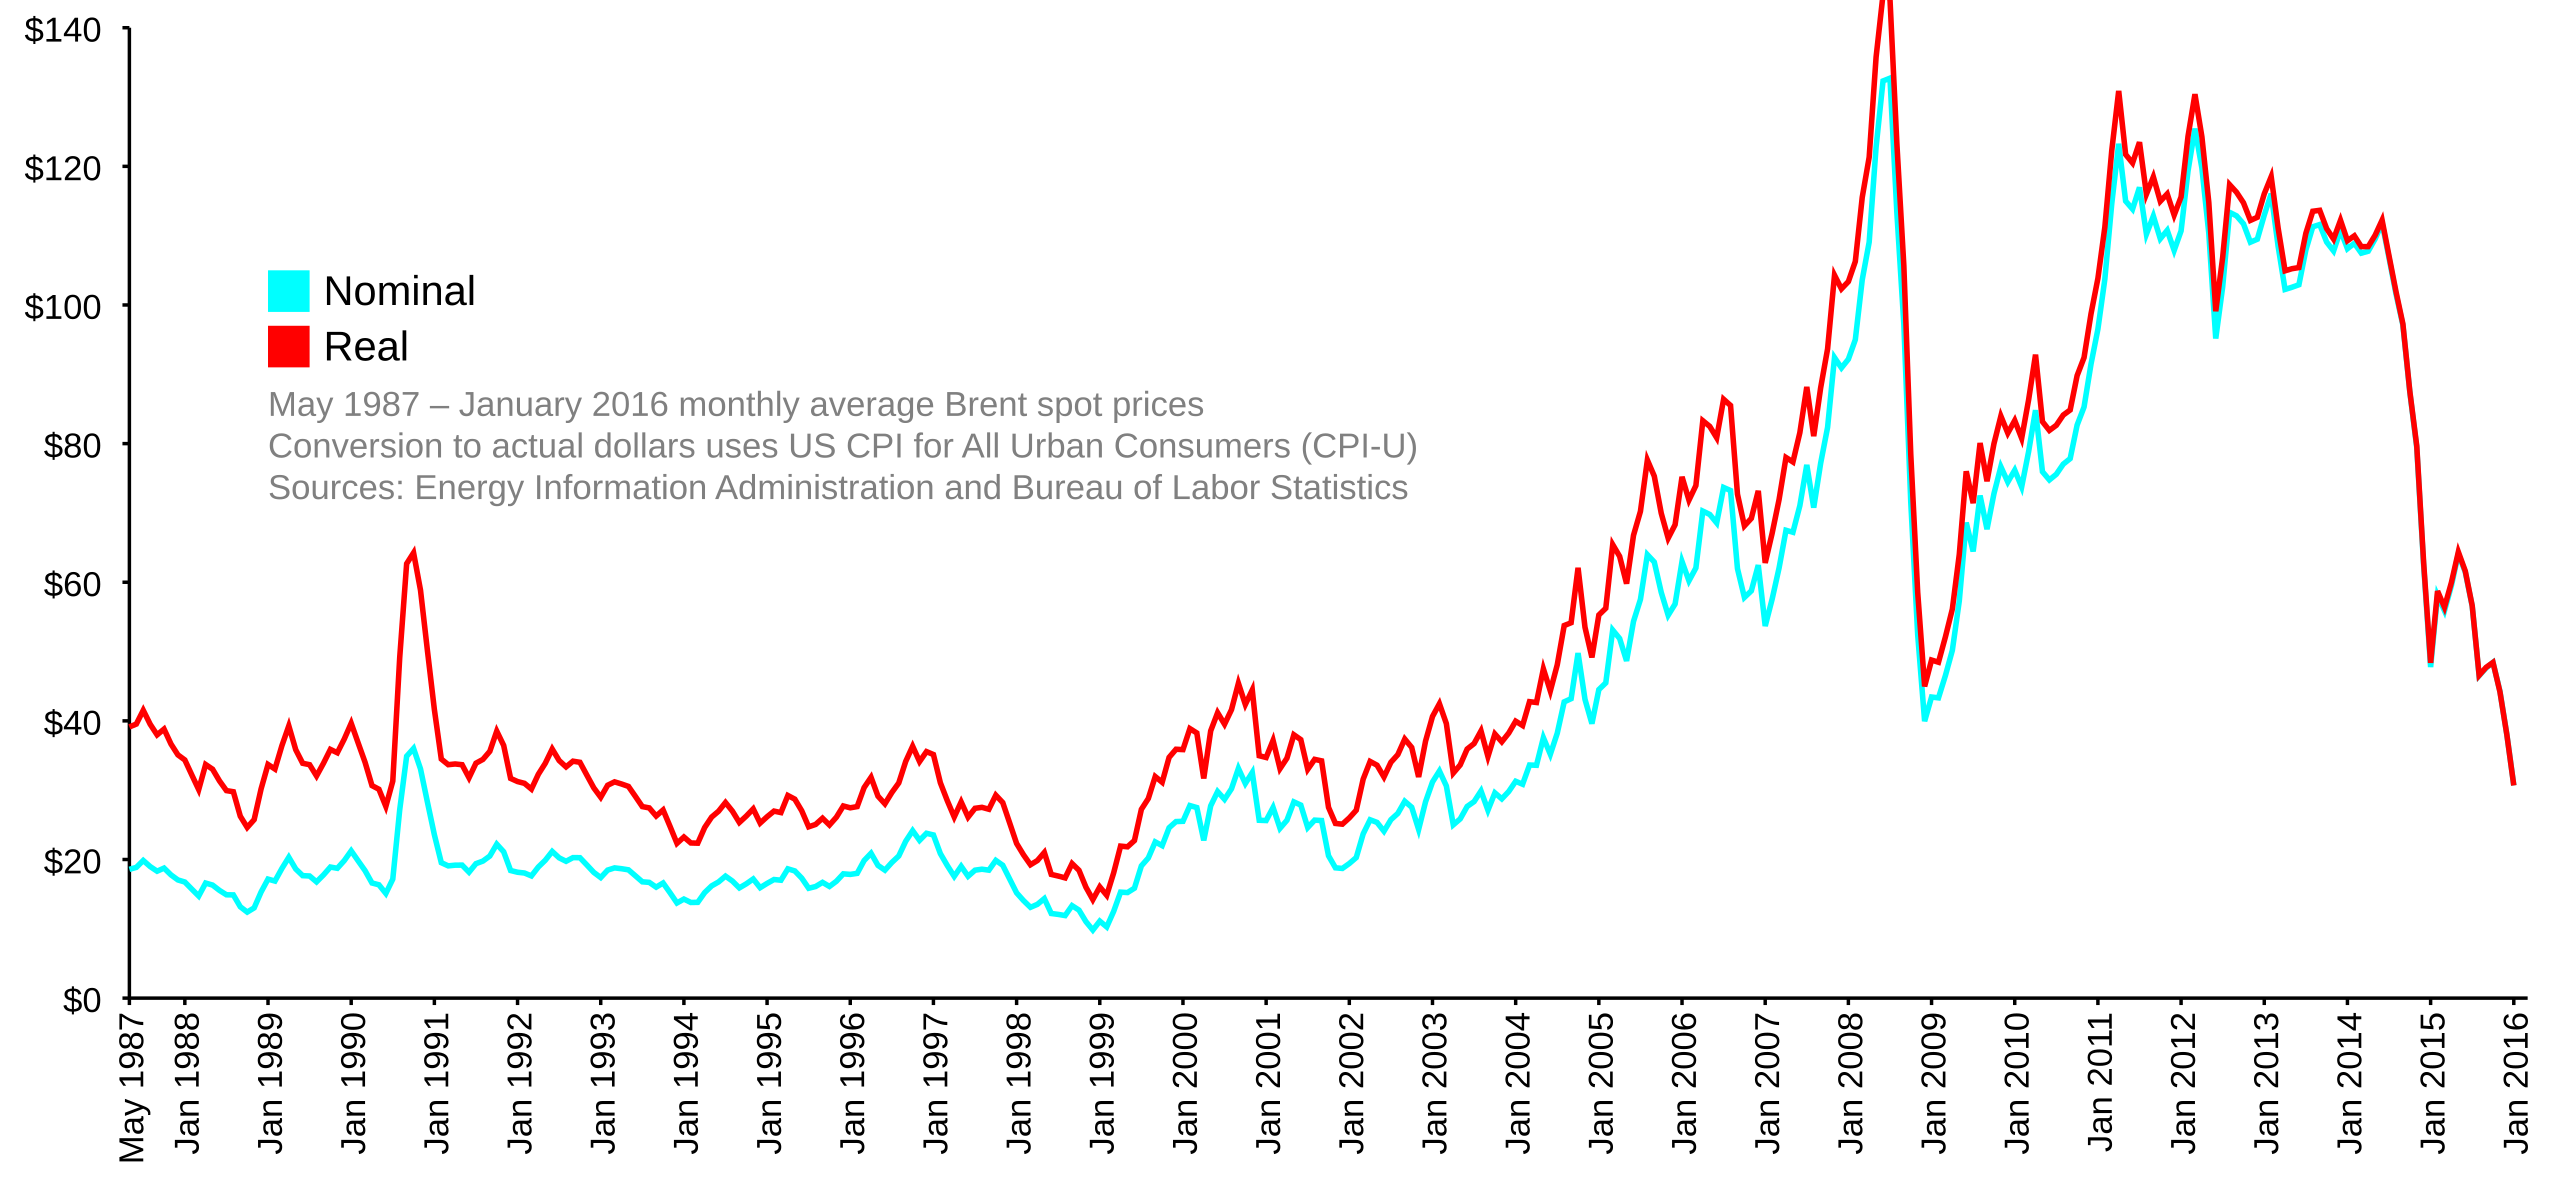
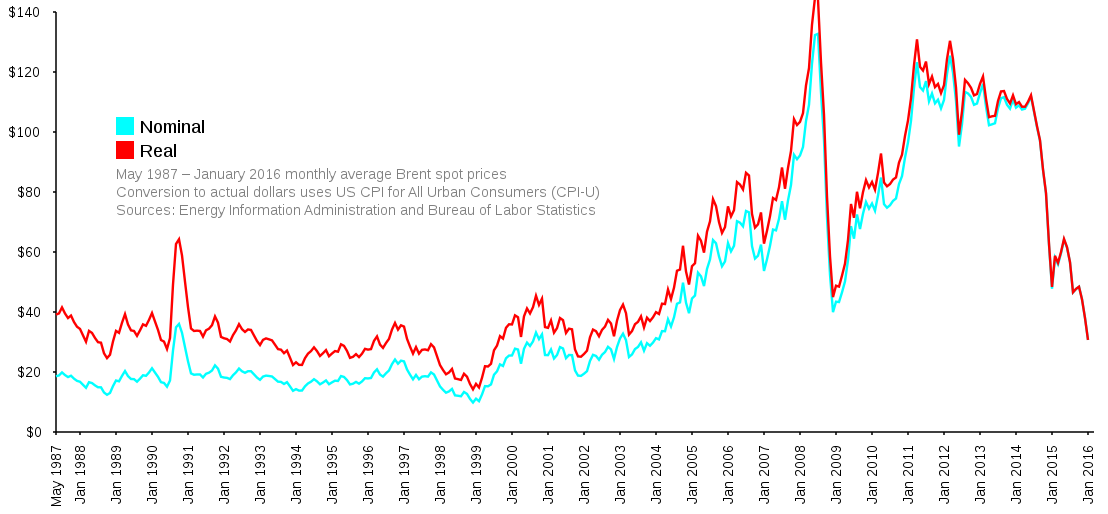
In the process of creating Image:Oil Prices 1861 2007.svg, I realized what an incredible wealth of information is available on the Energy Information Administration's web site. The 1861–2007 graph uses yearly averages, and I couldn't think of a really satisfying way to incorporate the price jumps of the past couple of months. Anyway, I think it's alright for a graph of 150 years of history to wait until the year's end to incorporate its data. Instead, I've created this graph, which uses all available monthly average Brent spot prices from this EIA spreadsheet and the United States Consumer Price Index for All Urban Consumers (CPI-U), seasonally adjusted, from here ( This is a direct link; but there may be a better one). The monthly numbers and limited date range give good detail, and coverage up to April 2008 shows the recent price jumps. It will be about a month before I can add May 2008, because it takes a little while for the Bureau of Labor Statistics to compile the CPI for the previous month.. I have no artistic talent whatsoever, so I know the color choices aren't great, but I have no eye for this stuff. I liked the blue and orange used by the 1861–2007 but I didn't want to use the same ones over again. I just chose a pair of RGB complementary colors. I am not married to this scheme; I'm happy to discuss alternatives. It's easy for me to make changes. I will probably make more graphs from EIA data in the future. It's getting easier to work with SVG, though I know I still have a lot to learn. |
| Date | |
| Source | Own work |
| Author | TomTheHand |
| Other versions |
 |
Other chart versions
This version is from the Federal Reserve Economic Database: FRED-Real and Nominal Oil Prices 1986-present
Licensing
- You are free:
- to share – to copy, distribute and transmit the work
- to remix – to adapt the work
- Under the following conditions:
- attribution – You must give appropriate credit, provide a link to the license, and indicate if changes were made. You may do so in any reasonable manner, but not in any way that suggests the licensor endorses you or your use.
- share alike – If you remix, transform, or build upon the material, you must distribute your contributions under the same or compatible license as the original.

|
Permission is granted to copy, distribute and/or modify this document under the terms of the GNU Free Documentation License, Version 1.2 or any later version published by the Free Software Foundation; with no Invariant Sections, no Front-Cover Texts, and no Back-Cover Texts. A copy of the license is included in the section entitled GNU Free Documentation License. |
| Annotations | This image is annotated: View the annotations at Commons |
File history
Click on a date/time to view the file as it appeared at that time.
| Date/Time | Thumbnail | Dimensions | User | Comment | |
|---|---|---|---|---|---|
| current | 16:03, 20 February 2016 |
| 1,108 × 514 (14 KB) | Kopiersperre | Update to January 2016 |
| 14:41, 15 December 2015 |
 | 1,108 × 514 (14 KB) | Kopiersperre | Update to October 2015 | |
| 01:05, 19 December 2014 |
 | 1,080 × 514 (13 KB) | Kopiersperre | Update to November 2014 | |
| 19:03, 24 March 2013 |
 | 1,020 × 514 (13 KB) | Nigelj | Update to Feb 2013 | |
| 23:00, 19 June 2012 |
 | 970 × 514 (12 KB) | Nigelj | Fix error | |
| 22:42, 19 June 2012 |
 | 970 × 514 (12 KB) | Nigelj | Update to May 2012 | |
| 17:41, 3 January 2012 |
 | 970 × 514 (12 KB) | Nigelj | Add data to November 2011, and adjust all past 'real' prices to November 2011 dollars. | |
| 19:17, 18 May 2011 |
 | 930 × 514 (12 KB) | Nigelj | Fix y-axis label size | |
| 19:13, 18 May 2011 |
 | 930 × 514 (12 KB) | Nigelj | One more try | |
| 19:05, 18 May 2011 |
 | 930 × 514 (17 KB) | Nigelj | Reverted to version as of 20:53, 4 February 2011. Well I've had enough of this. If someone else knows how to make a valid SVG file render here, they may try. |
File usage
Global file usage
The following other wikis use this file:
- Usage on ar.wikipedia.org
- Usage on ast.wikipedia.org
- Usage on bn.wikipedia.org
- Usage on ca.wikipedia.org
- Usage on cs.wikipedia.org
- Usage on cy.wikipedia.org
- Usage on de.wikipedia.org
- Usage on eo.wikipedia.org
- Usage on es.wikipedia.org
- Usage on et.wikipedia.org
- Usage on eu.wikipedia.org
- Usage on fa.wikipedia.org
- Usage on fi.wikipedia.org
- Usage on fr.wikipedia.org
- Usage on he.wikipedia.org
- Usage on hi.wikipedia.org
- Usage on it.wikipedia.org
- Usage on ja.wikipedia.org
- Usage on ko.wikipedia.org
- Usage on ms.wikipedia.org
- Usage on no.wikipedia.org
- Usage on pl.wikipedia.org
- Usage on ru.wikipedia.org
View more global usage of this file.