
Size of this PNG preview of this SVG file:
512 × 341 pixels. Other resolutions:
320 × 213 pixels |
640 × 426 pixels |
1,024 × 682 pixels |
1,280 × 853 pixels |
2,560 × 1,705 pixels.
Original file (SVG file, nominally 512 × 341 pixels, file size: 7 KB)
| This is a file from the
Wikimedia Commons. Information from its
description page there is shown below. Commons is a freely licensed media file repository. You can help. |
Summary
| Description |
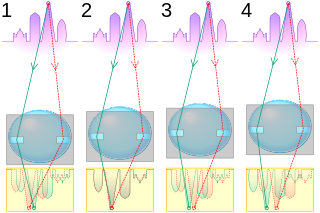
English: Illustration of autofocus using phase detection. In each figure, the purple circle represents the object to be focused on, the red and green lines represent light rays passing through apertures at the opposite sides of the lens, the yellow rectangle represents sensor arrays (one for each aperture), and the graph represents the intensity profile as seen by each sensor array. Figures 1 to 4 represent conditions where the lens is focused (1) too near, (2) correctly, (3) too far and (4) way too far. It can be seen from the graphs that the phase difference between the two profiles can be used to determine not just in which direction, but how much to move the lens to achieve optimal focus. Note: The figures are not to scale, and colours are used purely for clarity and do not represent any particular wavelength.
Italiano: Illustrazione di autofocus con rilevazione di fase. In ciascuna figura, il cerchio viola rappresenta l'oggetto da mettere a fuoco, le linee rosse e verdi rappresentano raggi di luce che passano attraverso aperture ai lati opposti della lente, il rettangolo giallo rappresenta la matrice di sensori (uno per ciascuna apertura) ed il grafico rappresenta il profilo di intensità visto da ogni matrice di sensori. Le figure da 1 a 4 rappresentano le condizioni in cui si concentra la lente (1) troppo vicino, (2) correttamente, (3) troppo e (4) troppo lontano. Si può vedere dai grafici che la differenza di fase tra i due profili può essere utilizzato per determinare non solo in quale direzione, ma anche di quanto bisogna spostare l'obiettivo per ottenere il fuoco ottimale. Nota: Le figure non sono in scala, ed i colori vengono utilizzati unicamente per chiarezza e non rappresentano qualsiasi lunghezza d'onda particolare. |
| Source | Own work |
| Author | Cmglee |
Licensing
I, the copyright holder of this work, hereby publish it under the following licenses:
This file is licensed under the
Creative Commons
Attribution-Share Alike 3.0 Unported license.
- You are free:
- to share – to copy, distribute and transmit the work
- to remix – to adapt the work
- Under the following conditions:
- attribution – You must give appropriate credit, provide a link to the license, and indicate if changes were made. You may do so in any reasonable manner, but not in any way that suggests the licensor endorses you or your use.
- share alike – If you remix, transform, or build upon the material, you must distribute your contributions under the same or compatible license as the original.

|
Permission is granted to copy, distribute and/or modify this document under the terms of the GNU Free Documentation License, Version 1.2 or any later version published by the Free Software Foundation; with no Invariant Sections, no Front-Cover Texts, and no Back-Cover Texts. A copy of the license is included in the section entitled GNU Free Documentation License. |
You may select the license of your choice.
File history
Click on a date/time to view the file as it appeared at that time.
| Date/Time | Thumbnail | Dimensions | User | Comment | |
|---|---|---|---|---|---|
| current | 21:21, 24 August 2017 |
| 512 × 341 (7 KB) | Cmglee | Make background opaque. |
| 21:20, 24 August 2017 |
 | 512 × 341 (7 KB) | Cmglee | Use more realistic profiles. | |
| 20:35, 16 January 2013 |
| 512 × 1,280 (5 KB) | Cmglee | Fix lens movement and add decoration. | |
| 00:09, 1 April 2012 |
 | 512 × 1,024 (5 KB) | Cmglee | {{Information |Description ={{en|1=Illustration of autofocus using phase detection. In each figure, the purple circle represents the object to be focused on, the red and green rays represent light rays passing through apertures at the extreme sides ... |
File usage
The following pages on the English Wikipedia use this file (pages on other projects are not listed):
Global file usage
The following other wikis use this file:
- Usage on fa.wikipedia.org
- Usage on fi.wikipedia.org
- Usage on fr.wikibooks.org
- Usage on it.wikipedia.org
- Usage on ja.wikipedia.org
- Usage on pl.wikipedia.org