Size of this preview:
750 × 600 pixels. Other resolutions:
300 × 240 pixels |
600 × 480 pixels |
960 × 768 pixels |
1,280 × 1,024 pixels |
1,500 × 1,200 pixels.
Original file (1,500 × 1,200 pixels, file size: 62 KB, MIME type: image/png)
| This is a file from the
Wikimedia Commons. Information from its
description page there is shown below. Commons is a freely licensed media file repository. You can help. |
Summary
| Description |
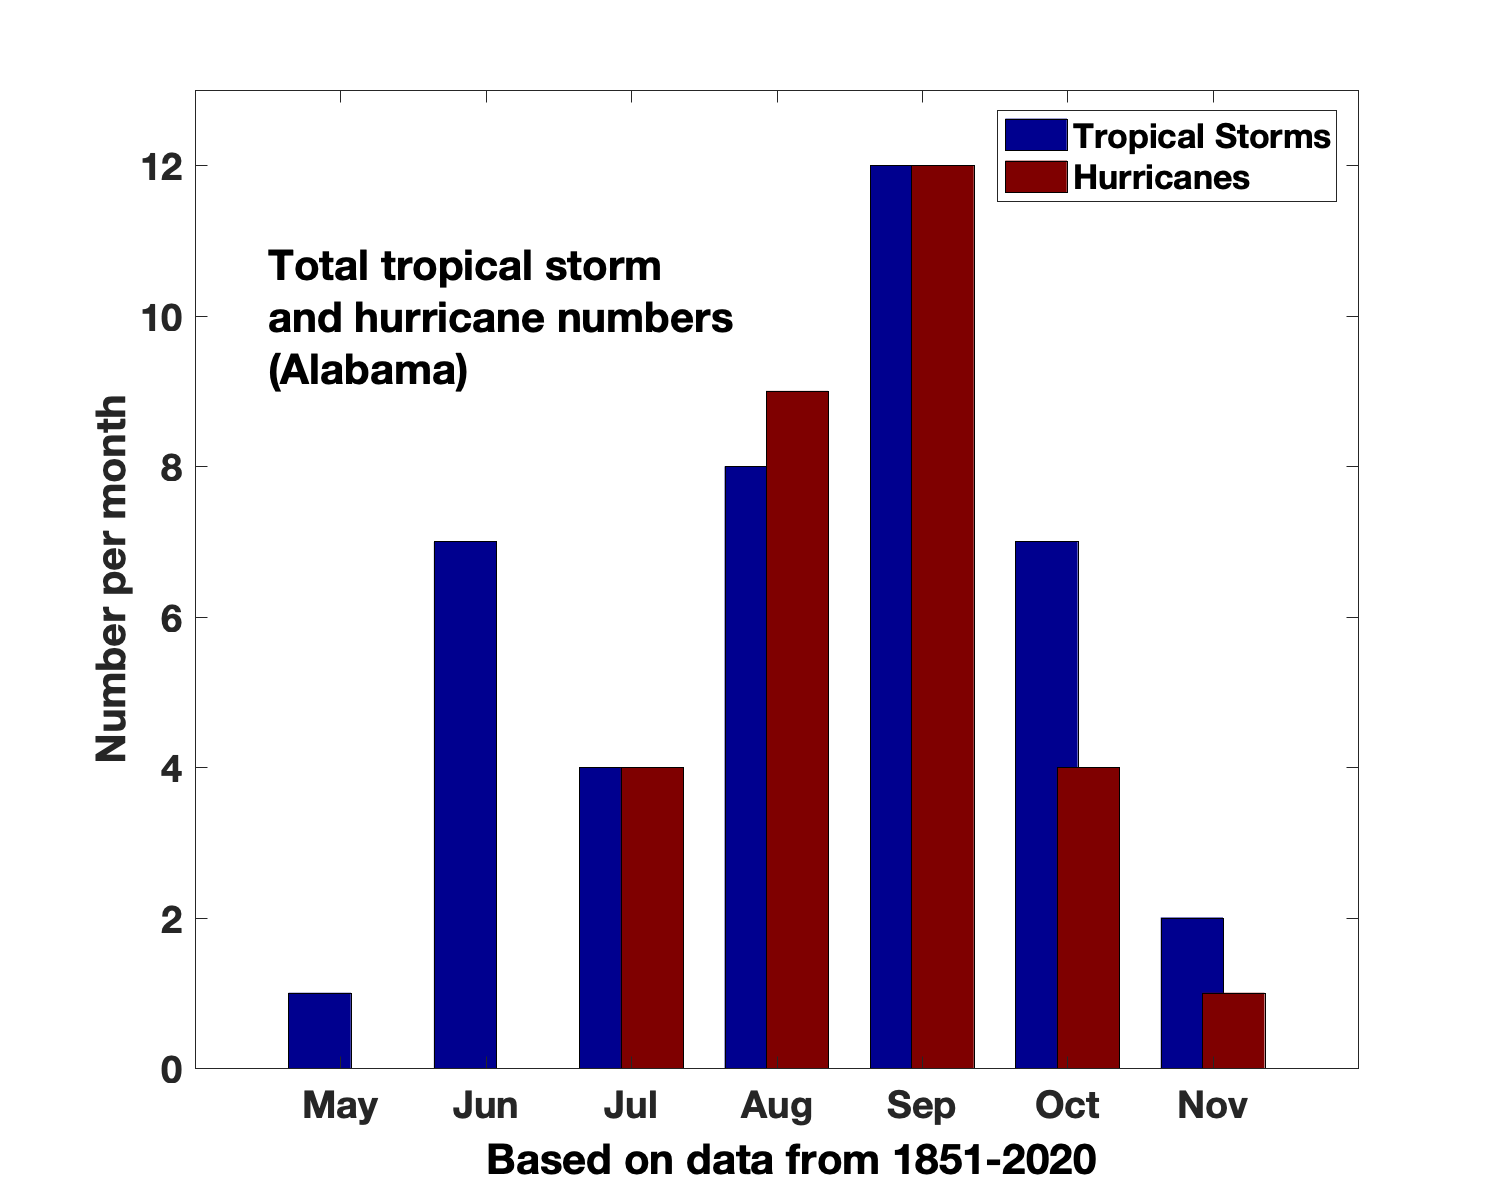
English: This figure shows the monthly distribution of Alabama hurricanes and tropical storms from the existing record (1851-2020) |
| Date | |
| Source | Own work |
| Author | Chicdat |
Licensing
I, the copyright holder of this work, hereby publish it under the following license:
This file is licensed under the
Creative Commons
Attribution-Share Alike 4.0 International license.
- You are free:
- to share – to copy, distribute and transmit the work
- to remix – to adapt the work
- Under the following conditions:
- attribution – You must give appropriate credit, provide a link to the license, and indicate if changes were made. You may do so in any reasonable manner, but not in any way that suggests the licensor endorses you or your use.
- share alike – If you remix, transform, or build upon the material, you must distribute your contributions under the same or compatible license as the original.
File history
Click on a date/time to view the file as it appeared at that time.
| Date/Time | Thumbnail | Dimensions | User | Comment | |
|---|---|---|---|---|---|
| current | 12:57, 20 March 2020 |
| 1,500 × 1,200 (62 KB) | Chicdat | Cross-wiki upload from en.wikipedia.org |
File usage
The following pages on the English Wikipedia use this file (pages on other projects are not listed):