
Size of this PNG preview of this SVG file:
800 × 533 pixels. Other resolutions:
320 × 213 pixels |
640 × 427 pixels |
1,024 × 683 pixels |
1,280 × 853 pixels |
2,560 × 1,707 pixels |
960 × 640 pixels.
Original file (SVG file, nominally 960 × 640 pixels, file size: 83 KB)
| This is a file from the
Wikimedia Commons. Information from its
description page there is shown below. Commons is a freely licensed media file repository. You can help. |
Summary
W3C-validity not checked.
| Description |
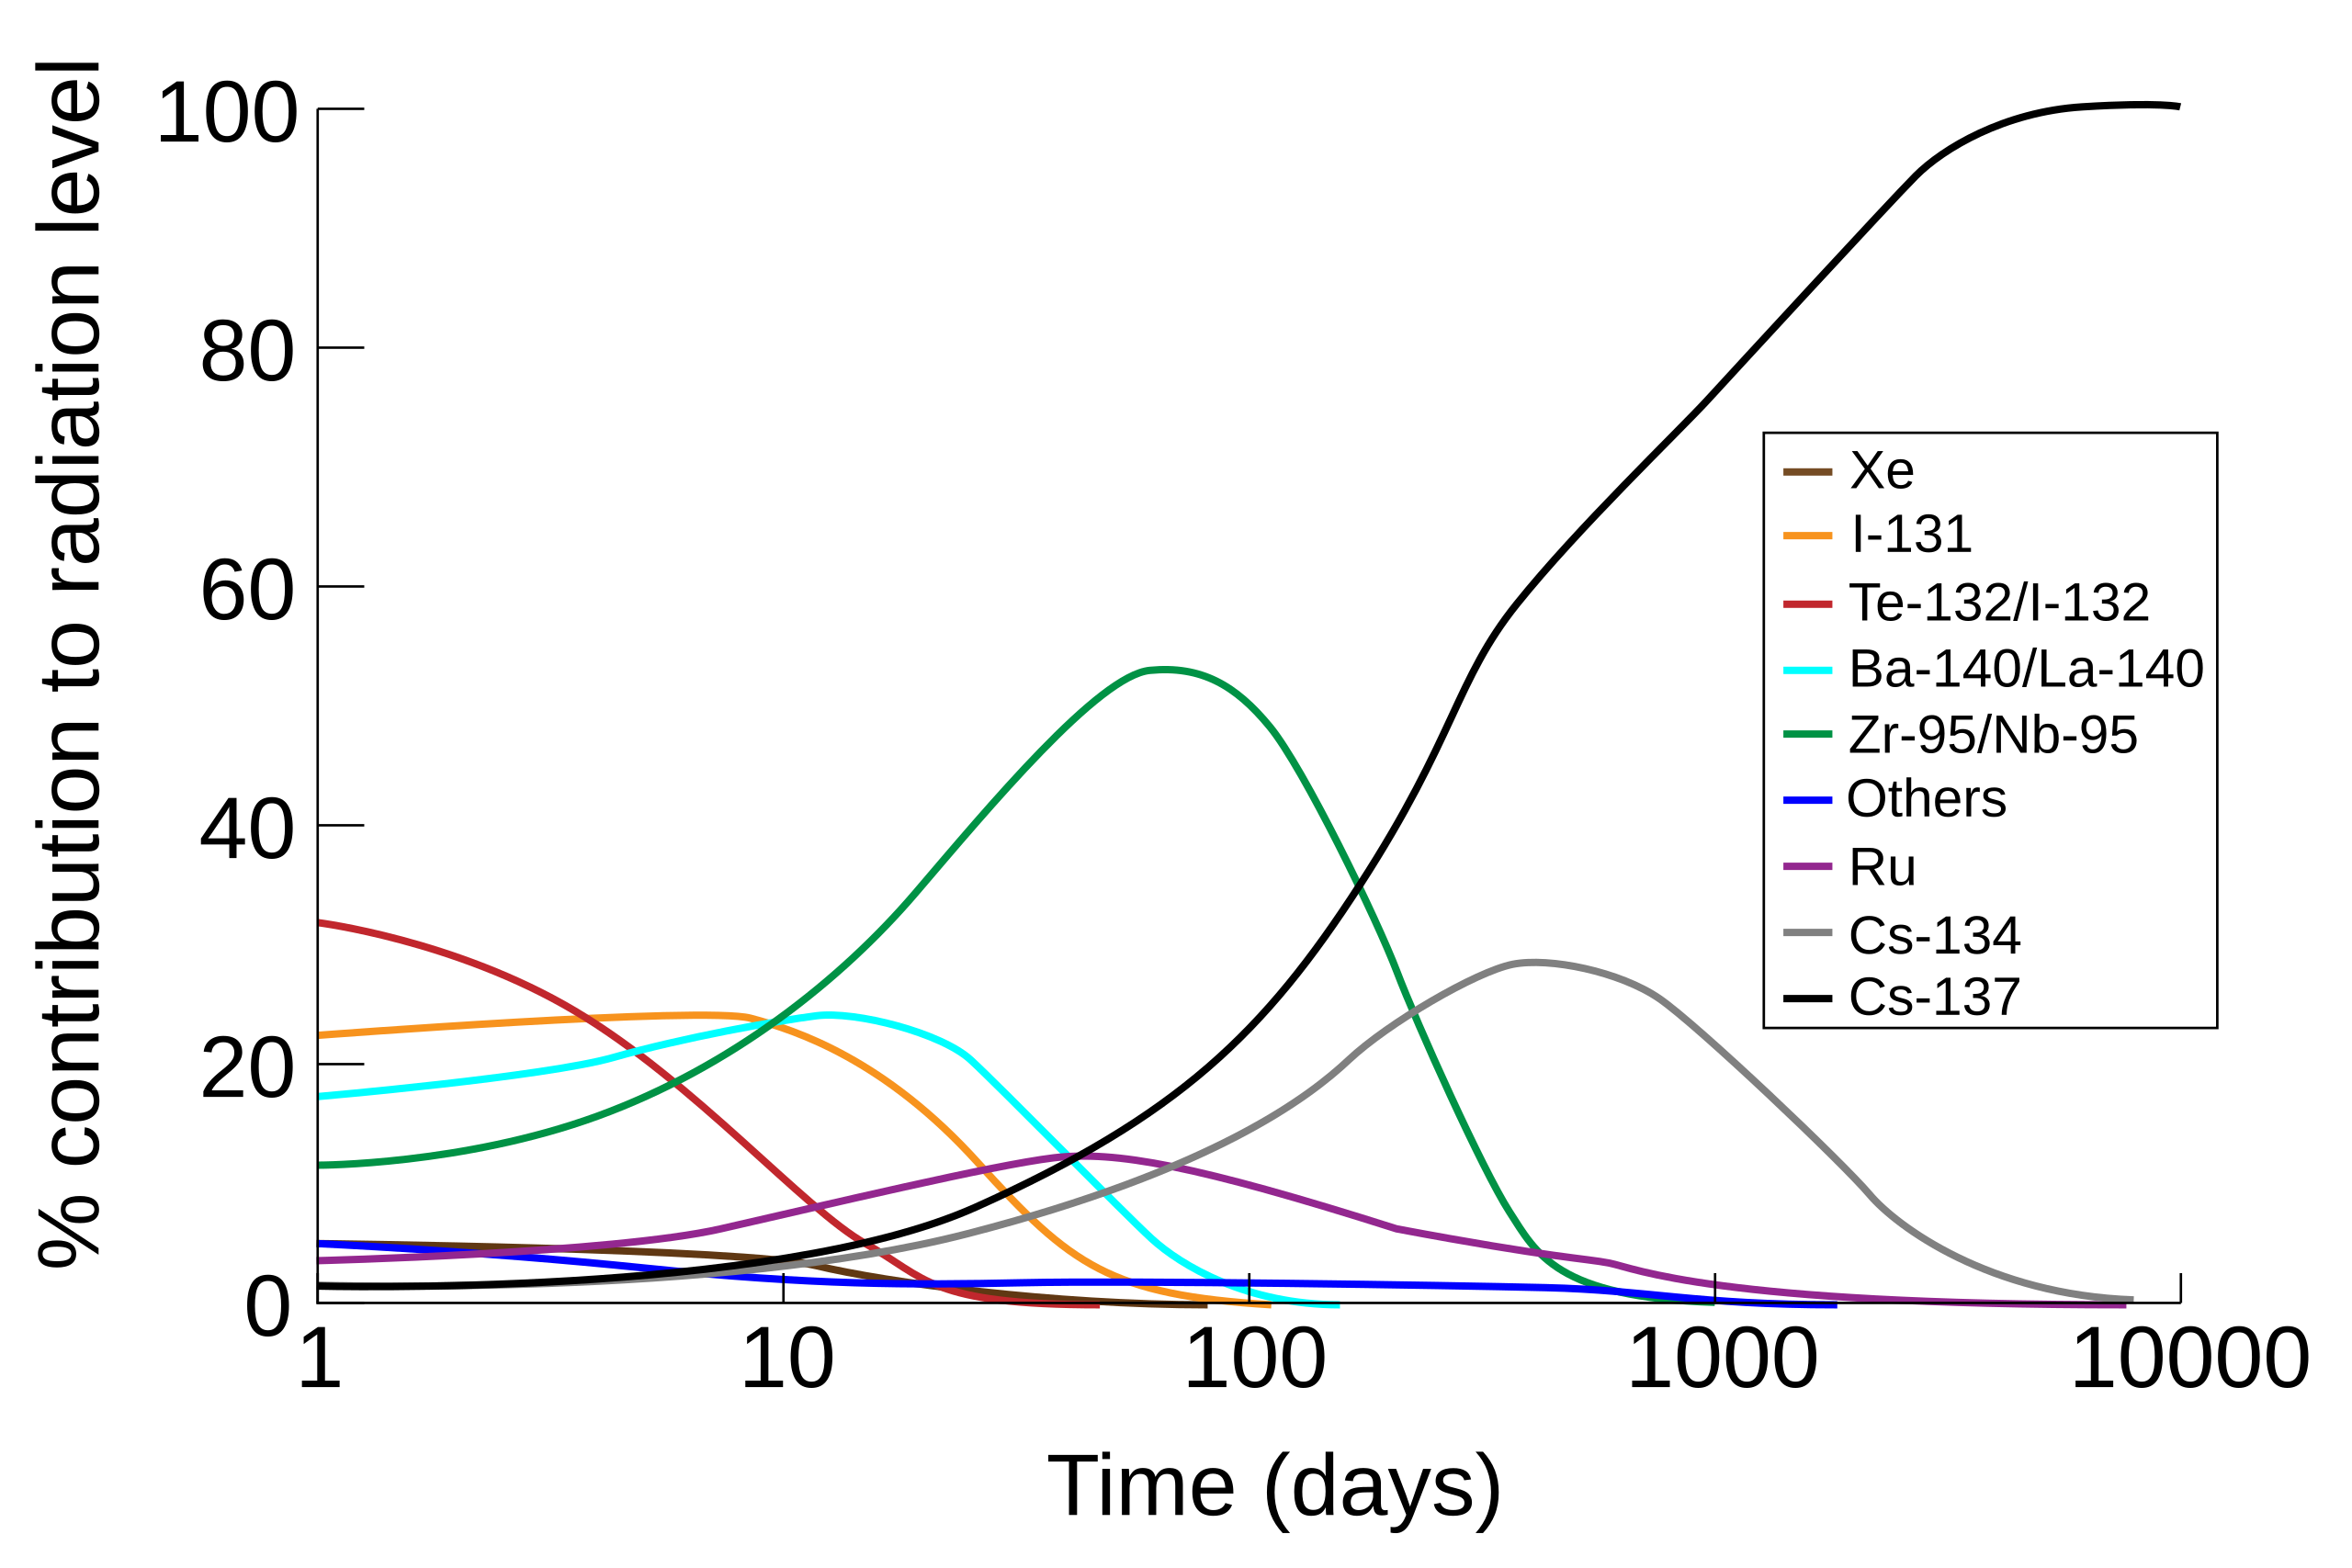
English: A graph showing the relative contributions made by different substances to the levels of radiation in Prypiat after the Chernobyl nuclear disaster.
Français : Graphique présentant la contribution relative des différents radionucléides au niveau de rayonnement enregistré à Prypiat après la catastrophe nucléaire de Tchernobyl |
| Date | |
| Source | Own work |
| Author | Freedo50 |

|
This SVG file contains embedded text that can be translated into your language, using any capable SVG editor, text editor or the SVG Translate tool. For more information see: About translating SVG files. |
Licensing
| I, the copyright holder of this work, release this work into the
public domain. This applies worldwide. In some countries this may not be legally possible; if so: I grant anyone the right to use this work for any purpose, without any conditions, unless such conditions are required by law. |
File history
Click on a date/time to view the file as it appeared at that time.
| Date/Time | Thumbnail | Dimensions | User | Comment | |
|---|---|---|---|---|---|
| current | 21:59, 27 May 2013 |
| 960 × 640 (83 KB) | Nigelj | Try again - or was it just some massive of server lag? |
| 21:49, 27 May 2013 |
 | 960 × 640 (83 KB) | Nigelj | Remove #f2f2f2 grey fill from various parts of the image - all transparent now | |
| 01:46, 21 April 2012 |
 | 960 × 640 (83 KB) | Ras67 | cropped, font imagining fixed | |
| 20:04, 24 May 2010 |
 | 1,000 × 1,000 (91 KB) | D-Kuru | * bigger box for the keybox * filling up the little white section where the x and the y axis meet * moving the lines so that they end in the y axis (they not exactly the same now but I you won't really notice the difference) | |
| 14:16, 6 July 2008 |
 | 1,000 × 1,000 (79 KB) | Tom | Reverted to version as of 16:36, 15 June 2008 | |
| 16:21, 29 June 2008 |
 | 930 × 605 (130 KB) | Ysangkok | ||
| 16:36, 15 June 2008 |
 | 1,000 × 1,000 (79 KB) | Dream out loud | removed embedded image | |
| 00:26, 12 May 2008 |
 | 1,000 × 1,000 (132 KB) | Freedo50 | {{Information |Description=A vector version of the Airdosechernobyl2 graphic. |Source=self-made |Date=12/05/2008 |Author= Freedo50 |Permission= |other_versions= }} |
File usage
The following pages on the English Wikipedia use this file (pages on other projects are not listed):
Global file usage
The following other wikis use this file:
- Usage on ar.wikipedia.org
- Usage on bn.wikipedia.org
- Usage on ckb.wikipedia.org
- Usage on es.wikipedia.org
- Usage on fr.wikipedia.org
- Usage on hr.wikipedia.org
- Usage on hu.wikipedia.org
- Usage on id.wikipedia.org
- Usage on it.wikipedia.org
- Usage on ja.wikipedia.org
- Usage on kn.wikipedia.org
- Usage on ko.wikipedia.org
- Usage on no.wikipedia.org
- Usage on ro.wikipedia.org
- Usage on ru.wikipedia.org
- Usage on sh.wikipedia.org
- Usage on th.wikipedia.org
- Usage on vi.wikipedia.org
- Usage on zh.wikipedia.org