Size of this preview:
800 × 547 pixels. Other resolutions:
320 × 219 pixels |
640 × 438 pixels |
911 × 623 pixels.
Original file (911 × 623 pixels, file size: 64 KB, MIME type: image/png)
| This is a file from the
Wikimedia Commons. Information from its
description page there is shown below. Commons is a freely licensed media file repository. You can help. |
Summary
| Description |
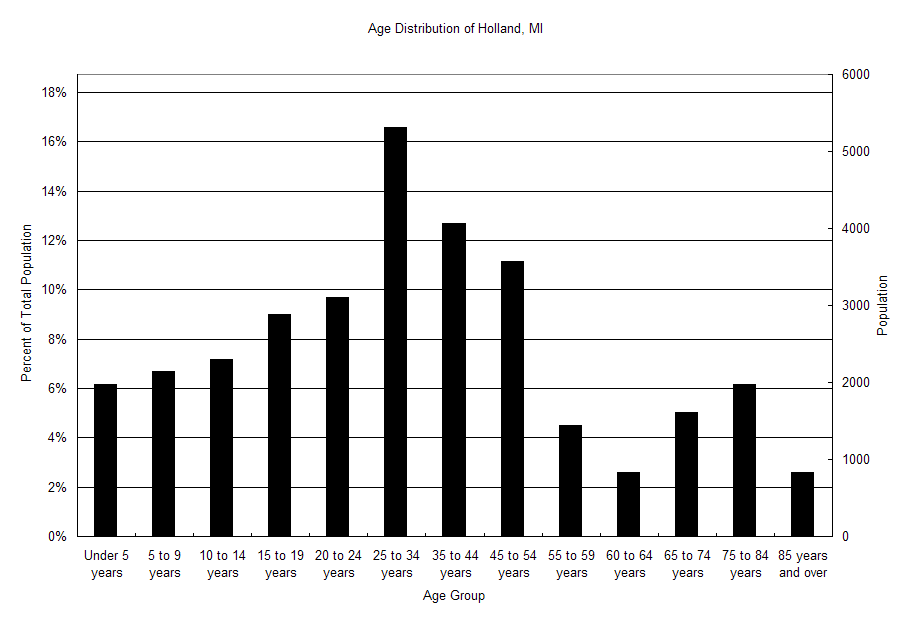
English: A graph showing population as a function of age of Holland, Michigan. Created using Microsoft Excel. |
| Date | |
| Source | I created this work entirely by myself. Source data from U.S. Census Bureau |
| Author | — Kortaggio Proclamations Declarations |
Licensing
| This chart is ineligible for
copyright and therefore in the
public domain, because it consists entirely of information that is common property and contains no original authorship. For more information, see
Commons:Threshold of originality § Charts
|
File history
Click on a date/time to view the file as it appeared at that time.
| Date/Time | Thumbnail | Dimensions | User | Comment | |
|---|---|---|---|---|---|
| current | 22:44, 12 July 2009 |
| 911 × 623 (64 KB) | Kortaggio | {{Information |Description = A graph showing population as a function of age of Holland, Michigan. Created using Microsoft Excel. |Source = I created this work entirely by myself. |Date = 12 July, 2009 |Author = ~~~ |othe |
File usage
The following pages on the English Wikipedia use this file (pages on other projects are not listed):