
Original file (SVG file, nominally 1,200 × 675 pixels, file size: 4 KB)
| This is a file from the
Wikimedia Commons. Information from its
description page there is shown below. Commons is a freely licensed media file repository. You can help. |
Summary
| Description |
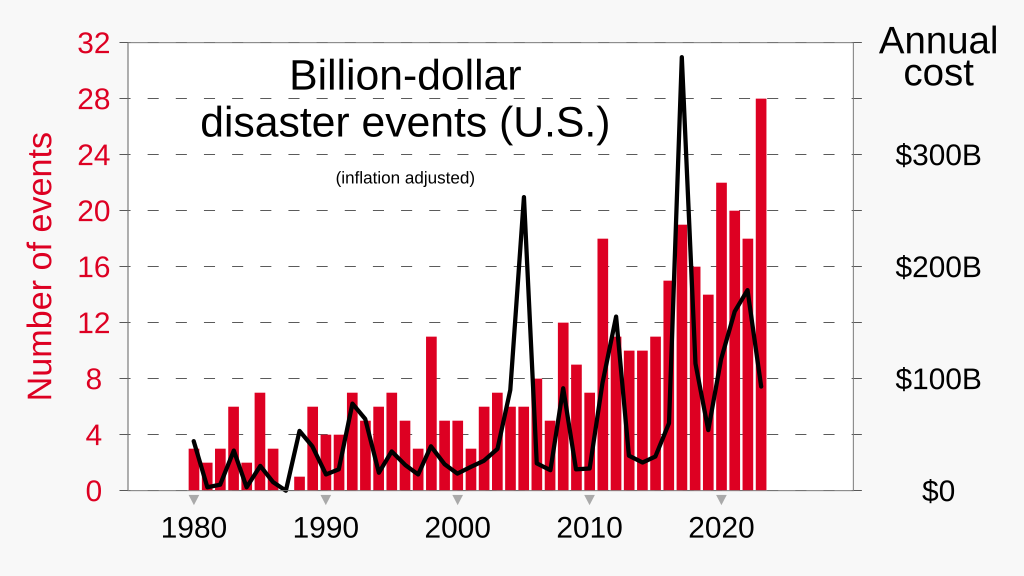
English: Graph of number billion-dollar climate-related events in the United States, and annual costs of those events, based on
NOAA's National Centers for Environmental Information.
|
| Date | |
| Source | Own work |
| Author | RCraig09 |
.png)
Source data
Data through 2023:
| Click at right to show/hide data |
|---|
|
Year — Disasters Count — Cost
|
Licensing
- You are free:
- to share – to copy, distribute and transmit the work
- to remix – to adapt the work
- Under the following conditions:
- attribution – You must give appropriate credit, provide a link to the license, and indicate if changes were made. You may do so in any reasonable manner, but not in any way that suggests the licensor endorses you or your use.
- share alike – If you remix, transform, or build upon the material, you must distribute your contributions under the same or compatible license as the original.
File history
Click on a date/time to view the file as it appeared at that time.
| Date/Time | Thumbnail | Dimensions | User | Comment | |
|---|---|---|---|---|---|
| current | 04:54, 13 January 2024 |
| 1,200 × 675 (4 KB) | RCraig09 | Version 9: revise to include data newly changed on NOAA website (25 ---> 28 events . . . . and $81.0B ---> $92.9B) |
| 21:13, 1 January 2024 |
 | 1,200 × 675 (4 KB) | RCraig09 | Version 8: update to include 2023 data | |
| 17:09, 15 January 2023 |
 | 1,200 × 675 (4 KB) | RCraig09 | Version 7: change shade of red (avoiding the "primary color" tendency that's apparently falling into disfavor) | |
| 05:50, 31 December 2022 |
 | 1,200 × 675 (4 KB) | RCraig09 | Version 6: update to include data for 2022 | |
| 22:53, 12 January 2022 |
 | 1,200 × 675 (4 KB) | RCraig09 | Version 5: change scale on right, so red and black traces occupy about the same vertical space | |
| 06:31, 12 January 2022 |
 | 1,200 × 675 (5 KB) | RCraig09 | Version 4: update to include 2021 data . . . changing width/height ratio | |
| 18:08, 22 February 2021 |
 | 1,000 × 630 (43 KB) | RCraig09 | Version 3: changed background shading so graph area is white and border is opaque light-gray | |
| 20:27, 8 January 2021 |
 | 1,000 × 630 (42 KB) | RCraig09 | Version 2: updating to include data through ENTIRE YEAR 2020 (not just through the Sept 2020 data that was in Version 1). | |
| 06:26, 12 December 2020 |
 | 1,000 × 630 (41 KB) | RCraig09 | Uploaded own work with UploadWizard |
File usage
Global file usage
The following other wikis use this file:
- Usage on ga.wikipedia.org
- Usage on zh.wikipedia.org