Size of this preview:
800 × 450 pixels. Other resolutions:
320 × 180 pixels |
640 × 360 pixels |
1,024 × 576 pixels |
1,280 × 720 pixels |
1,920 × 1,080 pixels.
Original file (1,920 × 1,080 pixels, file size: 661 KB, MIME type: image/png)
| This is a file from the
Wikimedia Commons. Information from its
description page there is shown below. Commons is a freely licensed media file repository. You can help. |
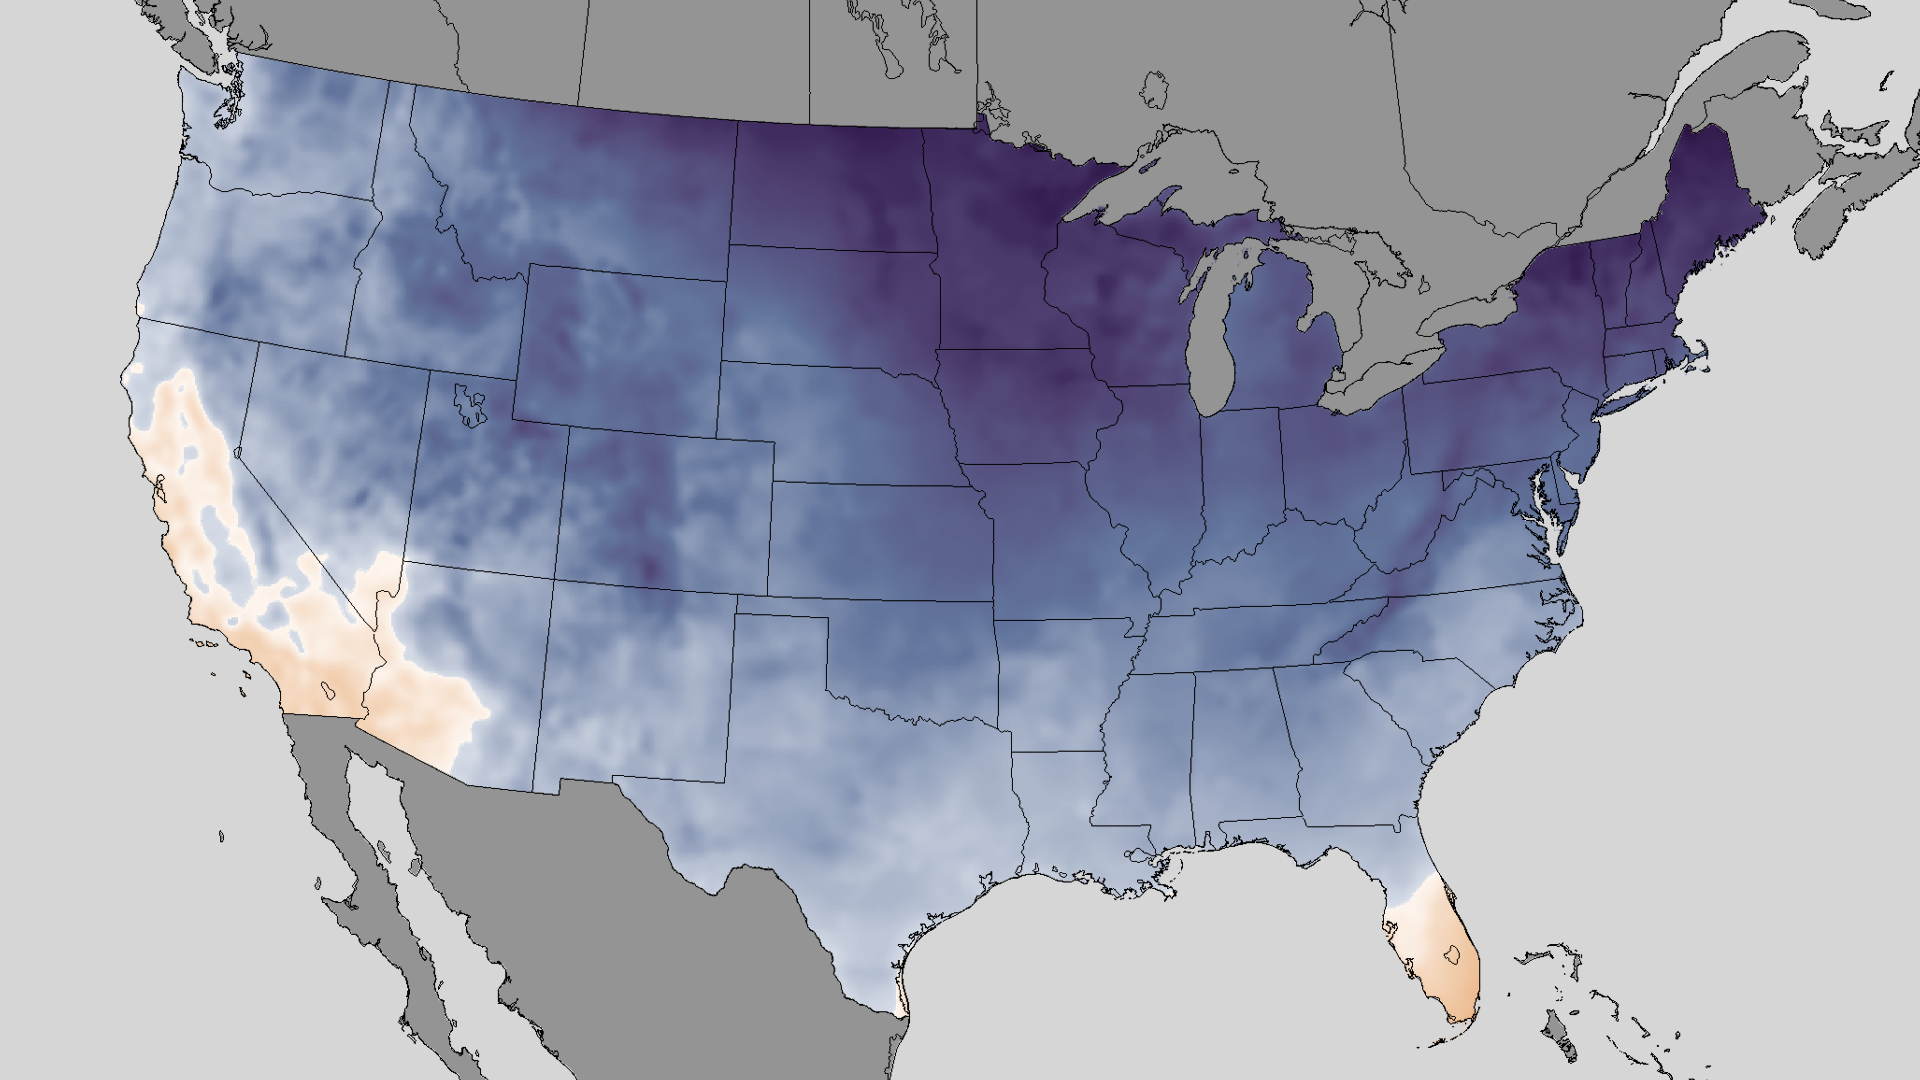
| Description | For most of the U.S., at some point during the January 2–4, 2014 time-frame, temperatures hit the freezing point. Using data from the National Weather Service's NDFD forecast and reanalysis, the minimum apparent temperature (i.e., wind chill) is plotted here. The color scale changes abruptly at 32 °F to a blue color. Only areas with pale orange/white are above freezing over the duration of those days. | |||
| Date | ||||
| Source | http://www.nnvl.noaa.gov/MediaDetail2.php?MediaID=1480&MediaTypeID=1 | |||
| Author | Environmental Visualization Laboratory | |||
| Permission ( Reusing this file) |
|
File history
Click on a date/time to view the file as it appeared at that time.
| Date/Time | Thumbnail | Dimensions | User | Comment | |
|---|---|---|---|---|---|
| current | 22:52, 19 September 2015 |
| 1,920 × 1,080 (661 KB) | Master of Time | {{Information |Description=For most of the U.S., at some point during the January 2–4, 2014 time-frame, temperatures hit the freezing point. Using data from the National Weather Service's NDFD forecast and reanalysis, the minimum apparent temperature... |
File usage
The following pages on the English Wikipedia use this file (pages on other projects are not listed):