Size of this preview:
800 × 495 pixels. Other resolutions:
320 × 198 pixels |
640 × 396 pixels |
1,024 × 634 pixels |
1,280 × 792 pixels |
2,560 × 1,585 pixels |
4,000 × 2,476 pixels.
Original file (4,000 × 2,476 pixels, file size: 6.28 MB, MIME type: image/png)
| This is a file from the
Wikimedia Commons. Information from its
description page there is shown below. Commons is a freely licensed media file repository. You can help. |
Summary
| Description |
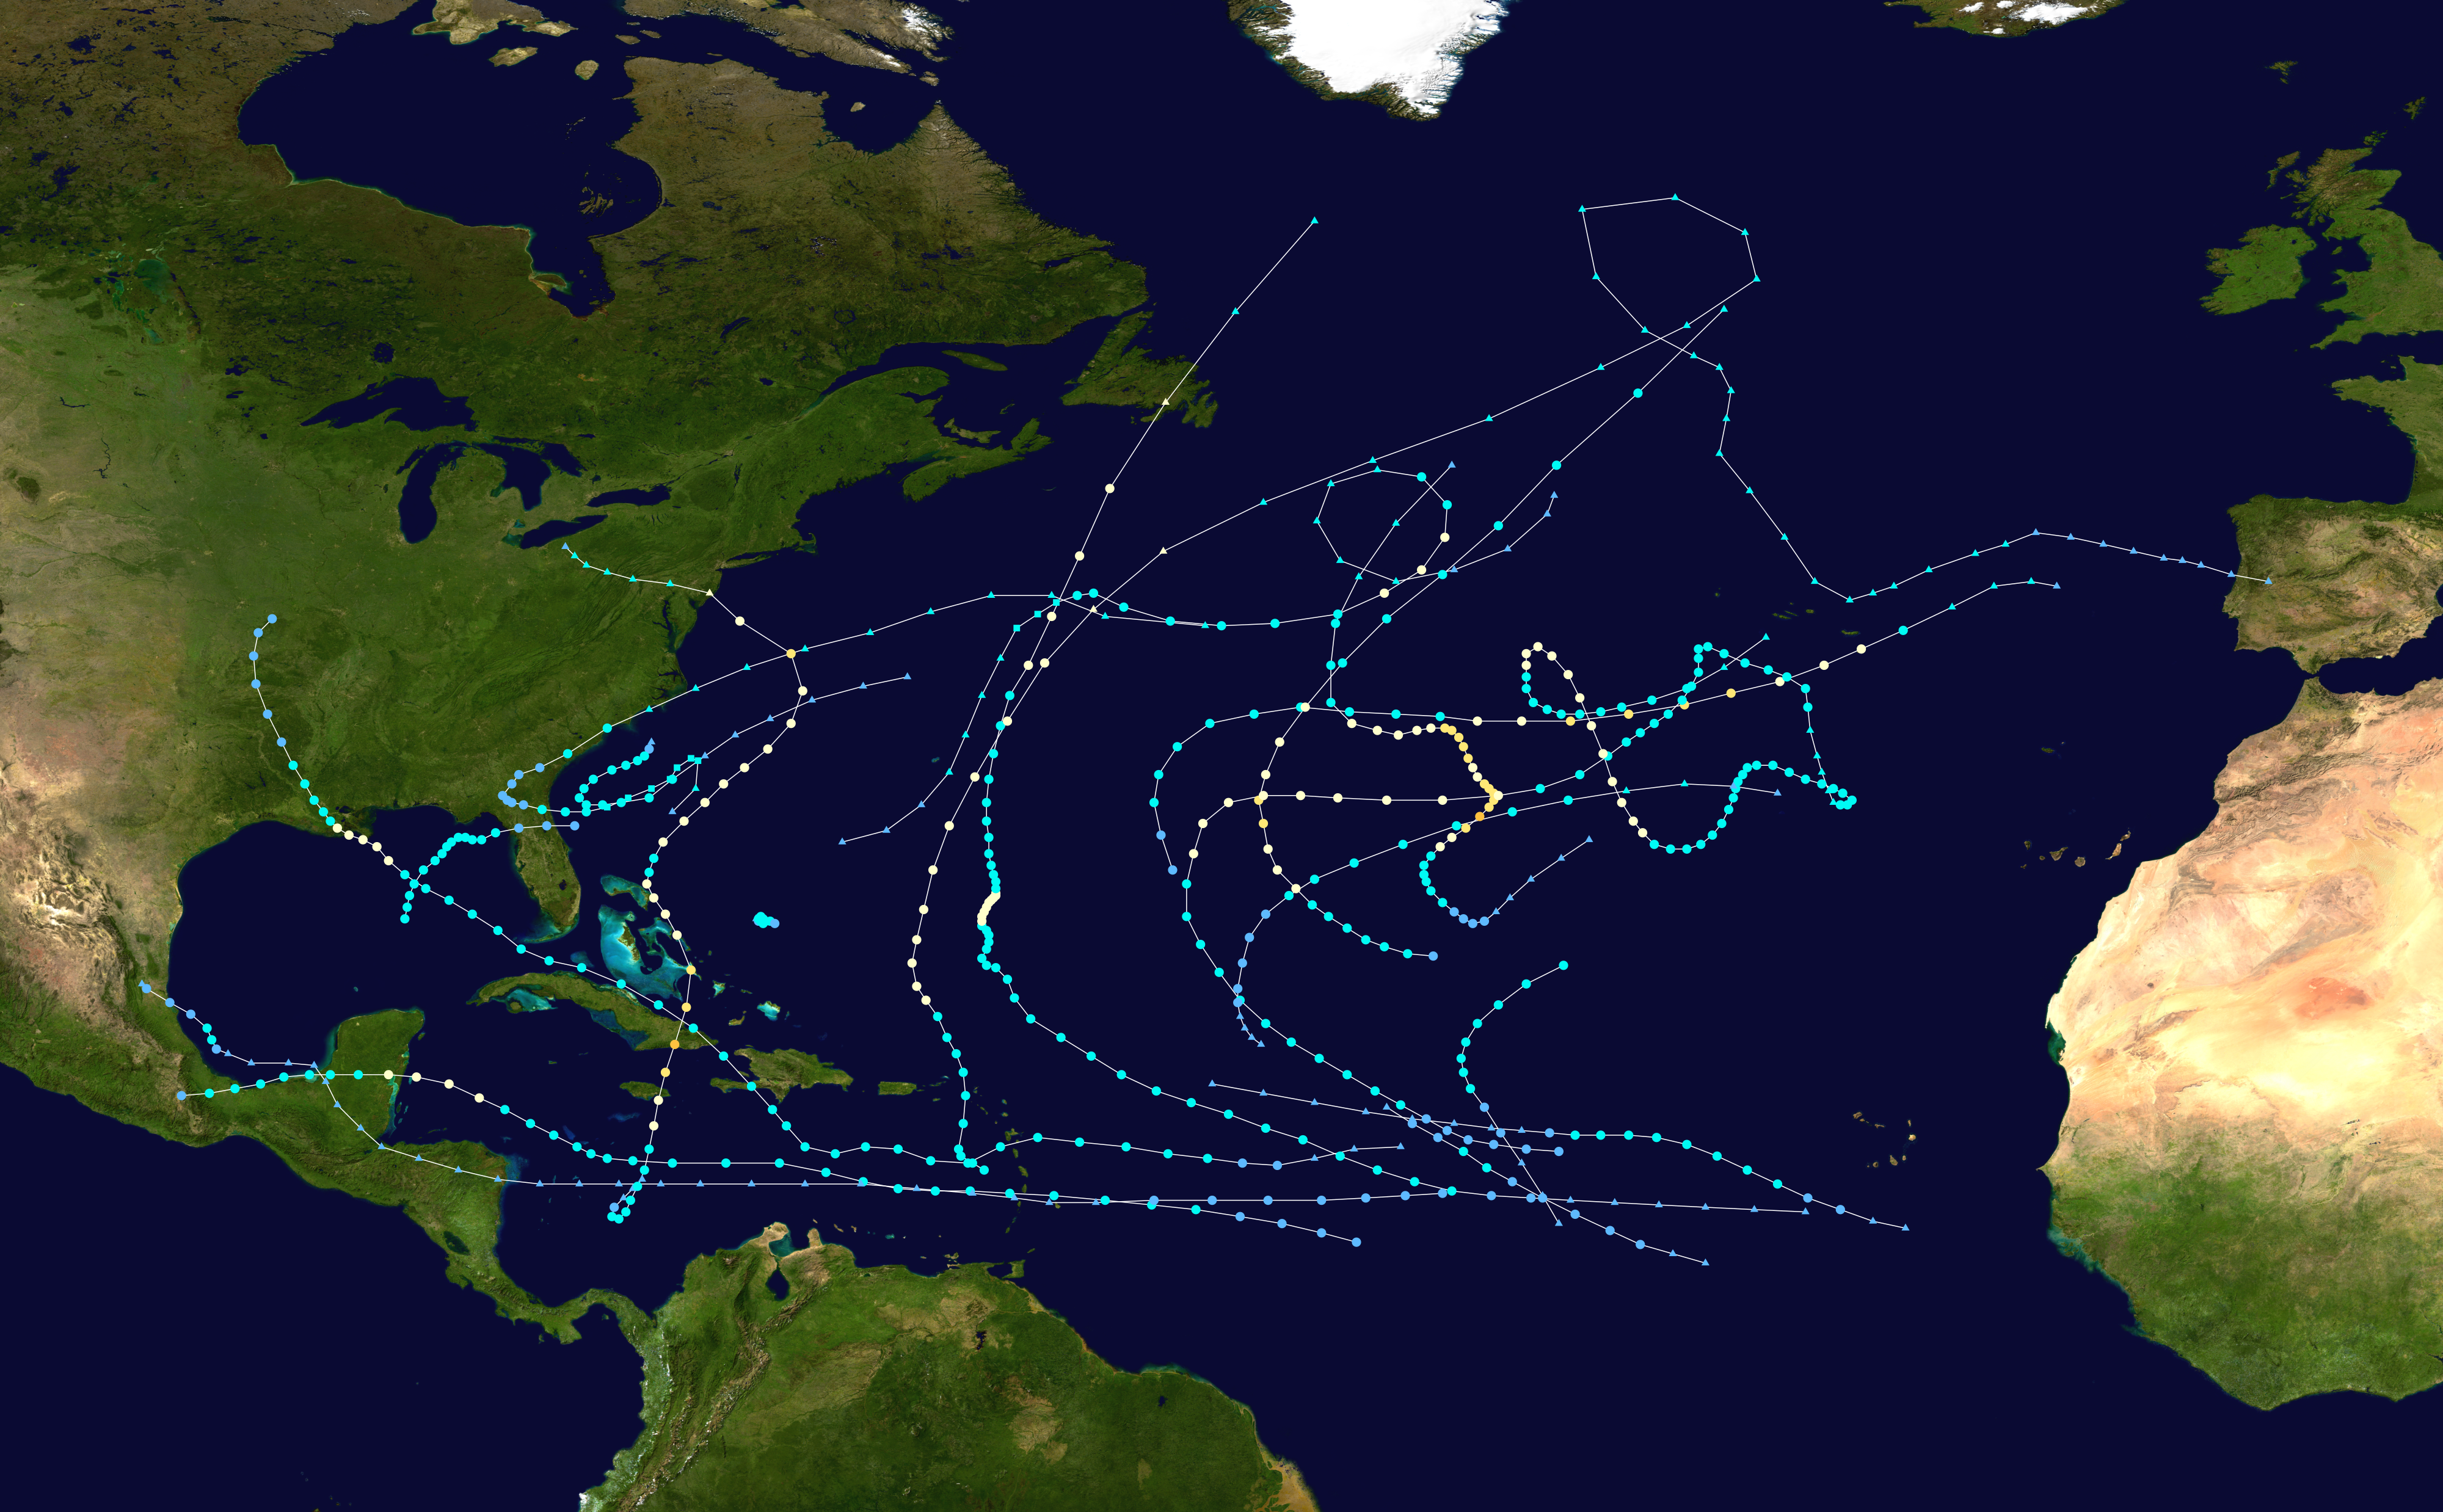
English: This map shows the tracks of all
tropical cyclones in the
2012 Atlantic hurricane season. The points show the location of each storm at 6-hour intervals. The colour represents the storm's
maximum sustained wind speeds as classified in the Saffir-Simpson Hurricane Scale (see below), and the shape of the data points represent the type of the storm.
Tropical depression (≤38 mph, ≤62 km/h)
Tropical storm (39–73 mph, 63–118 km/h)
Category 1 (74–95 mph, 119–153 km/h)
Category 2 (96–110 mph, 154–177 km/h)
Category 3 (111–129 mph, 178–208 km/h)
Category 4 (130–156 mph, 209–251 km/h)
Category 5 (≥157 mph, ≥252 km/h)
Unknown
Storm type |
| Source | Created using Wikipedia:WikiProject Tropical cyclones/Tracks. The background image is from NASA [1]. The tracking data is from the National Hurricane Center's Atlantic hurricane database |
| Author | Cyclonebiskit |

|
This file may be updated to reflect new information. If you wish to use a specific version of the file without new updates being mirrored, please upload the required version as a separate file. |
| This work has been released into the
public domain by its author,
Cyclonebiskit. This applies worldwide. In some countries this may not be legally possible; if so: Cyclonebiskit grants anyone the right to use this work for any purpose, without any conditions, unless such conditions are required by law. |
File history
Click on a date/time to view the file as it appeared at that time.
| Date/Time | Thumbnail | Dimensions | User | Comment | |
|---|---|---|---|---|---|
| current | 15:49, 28 November 2019 |
| 4,000 × 2,476 (6.28 MB) | Supportstorm | Corrected dimensions |
| 05:06, 28 July 2019 |
 | 4,000 × 2,472 (6.59 MB) | Supportstorm | Higher resolution, slight corrections | |
| 11:54, 25 July 2013 |
 | 3,000 × 1,854 (3.64 MB) | Cyclonebiskit | forgot to update Sandy | |
| 06:41, 6 February 2013 |
 | 3,000 × 1,854 (3.64 MB) | Cyclonebiskit | TCR updates | |
| 22:14, 8 January 2013 |
 | 3,000 × 1,907 (3.17 MB) | Cyclonebiskit | updates ahoy | |
| 23:17, 15 December 2012 |
 | 3,000 × 1,876 (3.13 MB) | Cyclonebiskit | some TCR updates | |
| 13:03, 5 November 2012 |
 | 3,000 × 1,862 (3.09 MB) | Cyclonebiskit | corrections, don't forget to mark ET points as such | |
| 09:10, 4 November 2012 |
 | 3,000 × 1,854 (3.43 MB) | Keith Edkins | Added Sandy, and correction the tracks are of course at en:Talk:2012 Atlantic hurricane season/ACE calcs | |
| 23:13, 25 October 2012 |
 | 3,000 × 1,854 (3.03 MB) | Cyclonebiskit | update | |
| 14:58, 24 October 2012 |
 | 3,000 × 1,854 (3.02 MB) | Cyclonebiskit | update |
File usage
The following pages on the English Wikipedia use this file (pages on other projects are not listed):
- 2012 Atlantic hurricane season
- Hurricane Ernesto (2012)
- Hurricane Isaac (2012)
- Hurricane Leslie (2012)
- Hurricane Nadine
- Hurricane Rafael
- Hurricane Sandy
- Meteorological history of Hurricane Sandy
- Timeline of the 2012 Atlantic hurricane season
- Tropical Storm Beryl (2012)
- Tropical Storm Debby (2012)
- Tropical Storm Helene (2012)
- User:12george1/Hurricane Isaac (2012)
- Wikipedia:WikiProject Tropical cyclones/Idea
- Wikipedia:WikiProject Tropical cyclones/Idea2
- Wikipedia:Wikipedia Signpost/2013-07-31/Featured content
- Wikipedia:Wikipedia Signpost/Single/2013-07-31
- Wikipedia talk:WikiProject Tropical cyclones/Archive 29
- Template:2012 Atlantic hurricane season buttons
Global file usage
The following other wikis use this file:
- Usage on de.wikipedia.org
- Usage on es.wikipedia.org
- Usage on fi.wikipedia.org
- Usage on fr.wikipedia.org
- Usage on ko.wikipedia.org
- Usage on nl.wikipedia.org
- Usage on pt.wikipedia.org
- Usage on simple.wikipedia.org
- Usage on sr.wikipedia.org
- Usage on vi.wikipedia.org
- Usage on www.wikidata.org
- Usage on zh.wikipedia.org