
Size of this preview:
800 × 557 pixels. Other resolutions:
320 × 223 pixels |
640 × 446 pixels |
1,024 × 713 pixels |
1,318 × 918 pixels.
Original file (1,318 × 918 pixels, file size: 315 KB, MIME type: image/jpeg)
| This is a file from the
Wikimedia Commons. Information from its
description page there is shown below. Commons is a freely licensed media file repository. You can help. |
| Description |
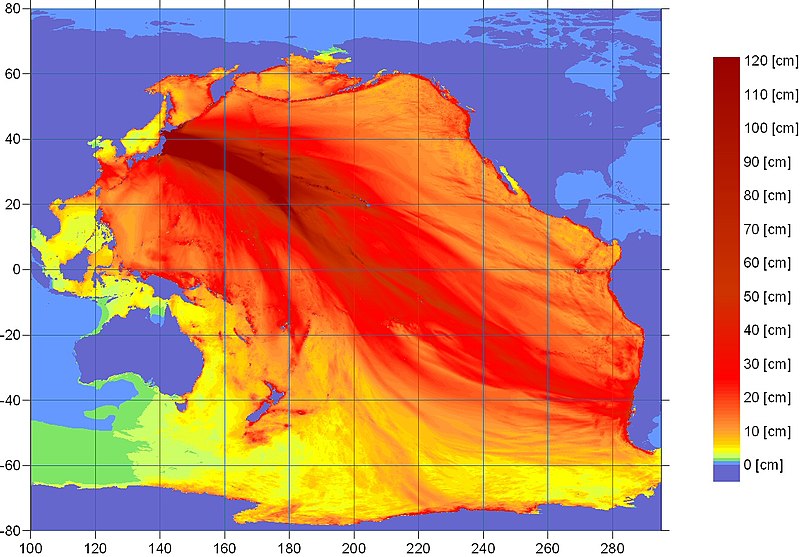
Deutsch: Tsunami-Ausbreitungsvorhersage (NOAA). Wellenhöhen farblich wiedergegeben.
English: Ocean energy distribution forecast map for the 2011 Sendai earthquake from the U.S. NOAA
Français : Carte prévisionnelle de l'amplitude de la vague du tsunami dans l'océan pour le
séisme de Sendai de 2011, d'après la
NOAA. L'échelle s'arrête à 120 cm, mais les vagues sur les côtes du Japon on été beaucoup plus importantes. |
|||
| Date | ||||
| Source | wcatwc.arh.noaa.gov (direct image URL [1]) There is a similar image here with a caption; "contours of forecasted maximum wave amplitudes [cm], detailing tsunami energy propagation". Presumably the scale simply stops at 120cm; but at the coasts the wave rises much higher. | |||
| Author | West Coast & Alaska Tsunami Warning Center, National Oceanic and Atmospheric Administration | |||
| Permission ( Reusing this file) |
|
|||
| Other versions |
 |
![[1]](http://wcatwc.arh.noaa.gov/2011/03/11/lhvpd9/energylhvpd9-05.jpg)
File history
Click on a date/time to view the file as it appeared at that time.
| Date/Time | Thumbnail | Dimensions | User | Comment | |
|---|---|---|---|---|---|
| current | 10:31, 11 March 2011 |
| 1,318 × 918 (315 KB) | Clindberg | {{Information |Description=Ocean energy distribution map for the 2011 Sendai earthquake from the U.S. NOAA |Source=[http://wcatwc.arh.noaa.gov/ wcatwc.arh.noaa.gov] (direct image URL [http://wcatwc.arh.noaa.gov/2011/03/11/lhvpd9/energylhvpd9-05.jpg]) |Dat |
File usage
The following pages on the English Wikipedia use this file (pages on other projects are not listed):
Global file usage
The following other wikis use this file:
- Usage on ast.wikipedia.org
- Usage on bg.wikipedia.org
- Usage on ca.wikipedia.org
- Usage on da.wikipedia.org
- Usage on de.wikipedia.org
- Usage on el.wikipedia.org
- Usage on en.wikibooks.org
- Usage on eo.wikipedia.org
- Usage on es.wikipedia.org
- Usage on fr.wikipedia.org
- Usage on hu.wikipedia.org
- Usage on id.wikipedia.org
- Usage on ja.wikipedia.org
- Usage on ko.wikipedia.org
- Usage on ms.wikipedia.org
- Usage on pl.wikipedia.org
- Usage on pt.wikipedia.org
- Usage on ru.wikipedia.org
- Usage on si.wikipedia.org
- Usage on sv.wikipedia.org
- Usage on th.wikipedia.org
- Usage on uk.wikipedia.org
- Usage on vi.wikipedia.org
- Usage on zh.wikipedia.org