
Size of this PNG preview of this SVG file:
800 × 450 pixels. Other resolutions:
320 × 180 pixels |
640 × 360 pixels |
1,024 × 576 pixels |
1,280 × 720 pixels |
2,560 × 1,440 pixels |
1,200 × 675 pixels.
Original file (SVG file, nominally 1,200 × 675 pixels, file size: 4 KB)
| This is a file from the
Wikimedia Commons. Information from its
description page there is shown below. Commons is a freely licensed media file repository. You can help. |
Summary
| Description |
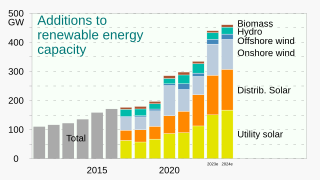
English: Bar chart (column graph) of the number of gigawatts of
w:renewable energy capacity (2011- ), as reported by the
w:International Energy Agency.
|
||
| Date | |||
| Source | Own work | ||
| Author | RCraig09 | ||
| Other versions |
|


Licensing
I, the copyright holder of this work, hereby publish it under the following license:
This file is licensed under the
Creative Commons
Attribution-Share Alike 4.0 International license.
- You are free:
- to share – to copy, distribute and transmit the work
- to remix – to adapt the work
- Under the following conditions:
- attribution – You must give appropriate credit, provide a link to the license, and indicate if changes were made. You may do so in any reasonable manner, but not in any way that suggests the licensor endorses you or your use.
- share alike – If you remix, transform, or build upon the material, you must distribute your contributions under the same or compatible license as the original.
File history
Click on a date/time to view the file as it appeared at that time.
| Date/Time | Thumbnail | Dimensions | User | Comment | |
|---|---|---|---|---|---|
| current | 10:15, 29 September 2023 |
| 1,200 × 675 (4 KB) | Jirka Dl | Reverted to version as of 21:33, 25 August 2023 (UTC) - translation will be in separate file |
| 08:00, 6 September 2023 |
 | 1,200 × 675 (6 KB) | Jirka Dl | File uploaded using svgtranslate tool (https://svgtranslate.toolforge.org/). Added translation for cs. | |
| 21:33, 25 August 2023 |
 | 1,200 × 675 (4 KB) | RCraig09 | Version 5: update to include data, and projected data, for 2024 | |
| 20:17, 15 September 2022 |
 | 1,100 × 700 (3 KB) | RCraig09 | Version 4: update with data through 2021 | |
| 20:01, 13 May 2021 |
 | 1,063 × 750 (3 KB) | RCraig09 | Version 3: reversed positions of Solar and Wind since Wind showed the greatest increase from 2019 to 2020. . . . Made colors more subdued. | |
| 01:56, 12 May 2021 |
 | 1,063 × 750 (3 KB) | RCraig09 | Version 2: Breaking down 2019 and 2020 components . . . Changing title to be more precise | |
| 22:10, 11 May 2021 |
 | 1,000 × 750 (2 KB) | RCraig09 | Uploaded own work with UploadWizard |
File usage
The following pages on the English Wikipedia use this file (pages on other projects are not listed):
Global file usage
The following other wikis use this file:
- Usage on bn.wikipedia.org
- Usage on cs.wikipedia.org
- Usage on ig.wikipedia.org
- Usage on ko.wikipedia.org
- Usage on no.wikipedia.org
- Usage on uz.wikipedia.org
- Usage on zu.wikipedia.org