Size of this preview:
800 × 495 pixels. Other resolutions:
320 × 198 pixels |
640 × 396 pixels |
1,024 × 634 pixels |
1,280 × 792 pixels |
2,560 × 1,585 pixels |
4,000 × 2,476 pixels.
Original file (4,000 × 2,476 pixels, file size: 6.14 MB, MIME type: image/png)
| This is a file from the
Wikimedia Commons. Information from its
description page there is shown below. Commons is a freely licensed media file repository. You can help. |
| Description |
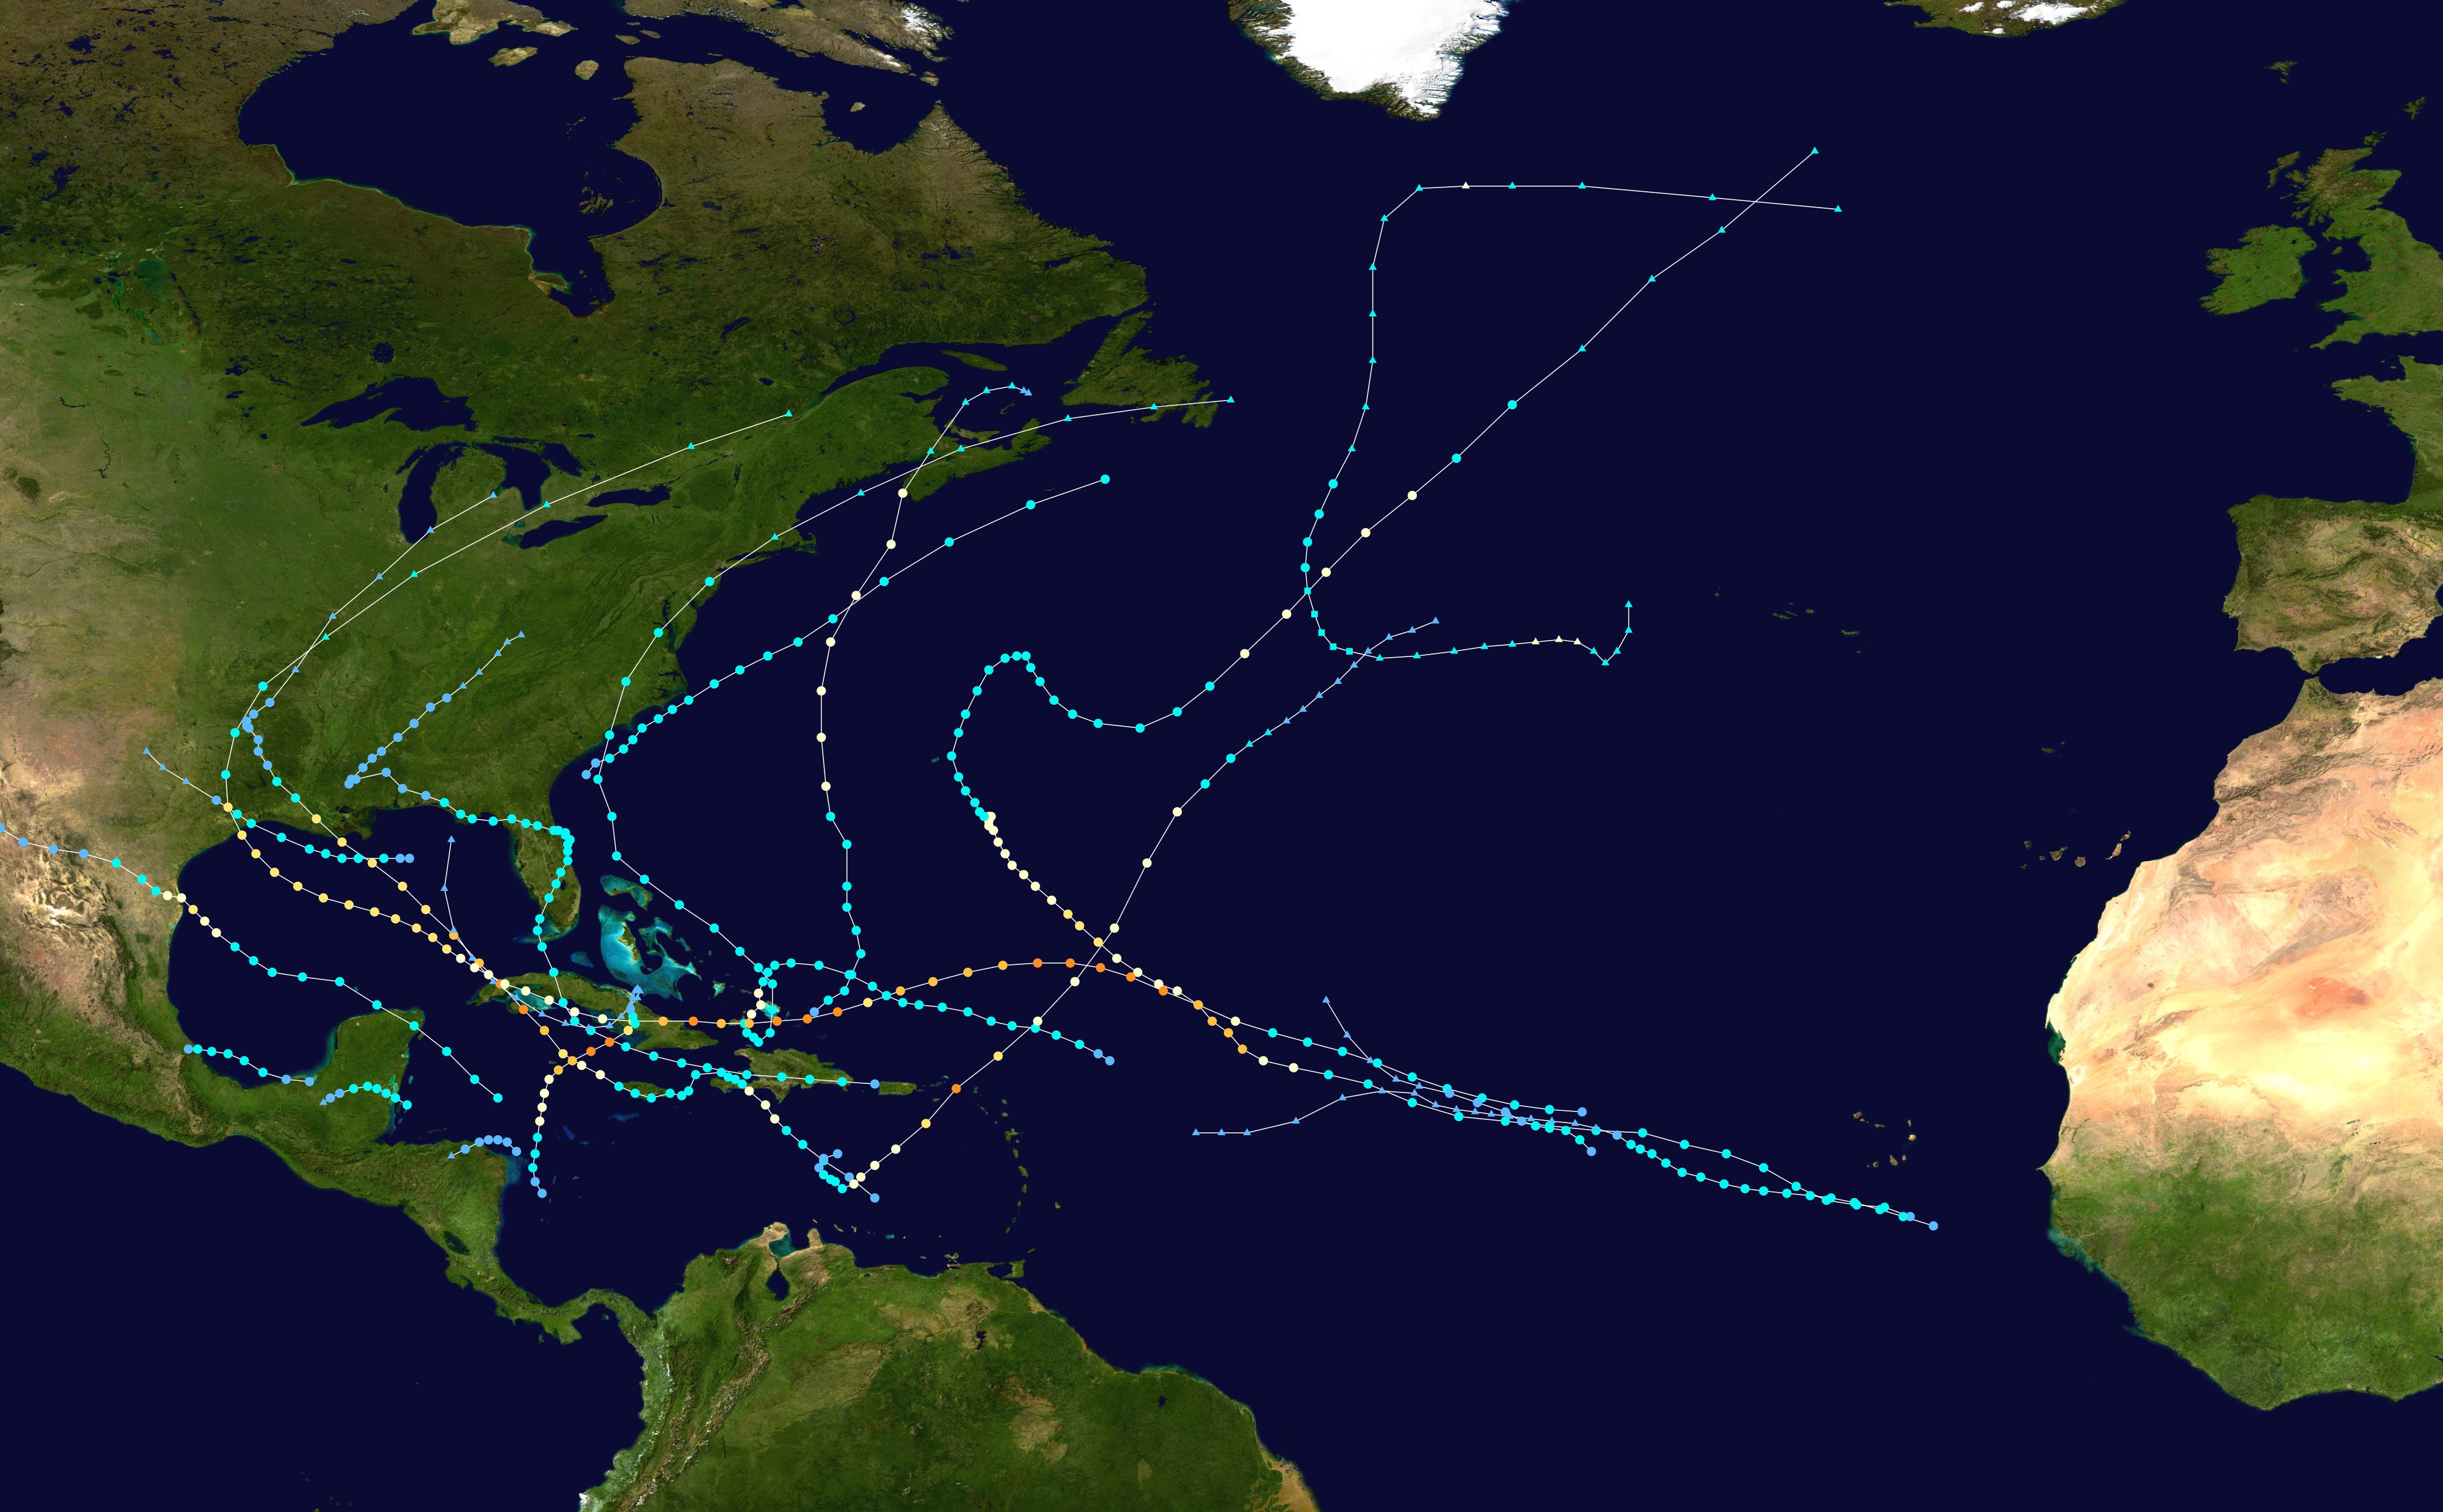
English: This map shows the tracks of all
tropical cyclones in the
2008 Atlantic hurricane season. The points show the location of each storm at 6-hour intervals. The colour represents the storm's
maximum sustained wind speeds as classified in the Saffir-Simpson Hurricane Scale (see below), and the shape of the data points represent the type of the storm.
Tropical depression (≤38 mph, ≤62 km/h)
Tropical storm (39–73 mph, 63–118 km/h)
Category 1 (74–95 mph, 119–153 km/h)
Category 2 (96–110 mph, 154–177 km/h)
Category 3 (111–129 mph, 178–208 km/h)
Category 4 (130–156 mph, 209–251 km/h)
Category 5 (≥157 mph, ≥252 km/h)
Unknown
Storm type |
| Source | Created using Wikipedia:WikiProject Tropical cyclones/Tracks. The background image is from NASA [1]. The tracking data is from the National Hurricane Center's Atlantic hurricane database |
| Author | Supportstorm |

|
This file may be updated to reflect new information. If you wish to use a specific version of the file without new updates being mirrored, please upload the required version as a separate file. |
| This work has been released into the
public domain by its author,
Supportstorm. This applies worldwide. In some countries this may not be legally possible; if so: Supportstorm grants anyone the right to use this work for any purpose, without any conditions, unless such conditions are required by law. |
File history
Click on a date/time to view the file as it appeared at that time.
| Date/Time | Thumbnail | Dimensions | User | Comment | |
|---|---|---|---|---|---|
| current | 08:17, 18 August 2019 |
| 4,000 × 2,476 (6.14 MB) | Supportstorm | Higher quality |
| 23:05, 10 April 2019 |
 | 4,000 × 2,472 (8.74 MB) | Es204L | fasfsa | |
| 18:02, 2 March 2019 |
 | 3,000 × 1,854 (3.76 MB) | Es204L | Reverted to version as of 19:09, 9 June 2013 (UTC) | |
| 21:18, 13 March 2018 |
 | 4,000 × 2,472 (8.74 MB) | HurricaneTyphoon2018 | Added dimensions and size both | |
| 19:09, 9 June 2013 |
 | 3,000 × 1,854 (3.76 MB) | Supportstorm | {{Hurricane season auto track map|start=|end=|source=ATL|type=hurricane|basin=Atlantic|year=2008|author=Supportstorm}} |
File usage
The following pages on the English Wikipedia use this file (pages on other projects are not listed):
- 2008 Atlantic hurricane season
- Hurricane Bertha (2008)
- Hurricane Dolly (2008)
- Hurricane Gustav
- Hurricane Hanna (2008)
- Hurricane Ike
- Hurricane Kyle (2008)
- Hurricane Omar
- Hurricane Paloma
- Meteorological history of Hurricane Gustav
- October 2008 Central America floods
- Timeline of the 2008 Atlantic hurricane season
- Tropical Storm Arthur (2008)
- Tropical Storm Cristobal (2008)
- Tropical Storm Edouard (2008)
- Tropical Storm Fay (2008)
- Tropical Storm Laura (2008)
- Tropical Storm Marco (2008)
- Tropical cyclones in 2008
- User:Darren23/Ike
- User:Darren23/Sandbox5
- User:Hurricanefan25/Sandbox 8
- User:Itfc+canes=me/Laura
- User:Itfc+canes=me/sandbox/Tropical Storm Paloma (2008)
- Template:2008 Atlantic hurricane season buttons
Global file usage
The following other wikis use this file:
- Usage on de.wikipedia.org
- Usage on es.wikipedia.org
- Usage on ko.wikipedia.org
- Usage on pt.wikipedia.org
- Usage on simple.wikipedia.org
- Usage on zh.wikipedia.org