
Size of this preview:
800 × 351 pixels. Other resolutions:
320 × 140 pixels |
640 × 281 pixels |
1,425 × 625 pixels.
Original file (1,425 × 625 pixels, file size: 61 KB, MIME type: image/png)
| This is a file from the
Wikimedia Commons. Information from its
description page there is shown below. Commons is a freely licensed media file repository. You can help. |
Summary
| Description |
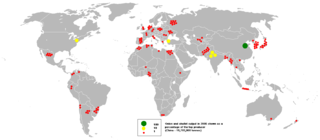
This bubble map shows the global distribution of onion and shallot output in 2005 as a percentage of the top producer (China - 19,793,000 tonnes). This map is consistent with incomplete set of data too as long as the top producer is known. It resolves the accessibility issues faced by colour-coded maps that may not be properly rendered in old computer screens. Data was extracted on 11th June 2007 from http://faostat.fao.org/site/336/DesktopDefault.aspx?PageID=336 Based on en:Image:BlankMap-World.png |
| Date | 11 June 2007 (original upload date) |
| Source | Transferred from en.wikipedia to Commons. |
| Author | Anwar saadat at English Wikipedia |

|
This economic map image could be re-created using
vector graphics as an
SVG file. This has several advantages; see
Commons:Media for cleanup for more information. If an SVG form of this image is available, please upload it and afterwards replace this template with
{{
vector version available|new image name}}
.
It is recommended to name the SVG file “2005onion and shallot.svg”—then the template Vector version available (or Vva) does not need the new image name parameter. |
Licensing
| This work has been released into the
public domain by its author,
Anwar saadat at
English Wikipedia. This applies worldwide. In some countries this may not be legally possible; if so: Anwar saadat grants anyone the right to use this work for any purpose, without any conditions, unless such conditions are required by law. |
Original upload log
The original description page was
here. All following user names refer to en.wikipedia.
- 2007-06-11 16:04 Anwar saadat 1425×625×8 (62405 bytes)
File history
Click on a date/time to view the file as it appeared at that time.
| Date/Time | Thumbnail | Dimensions | User | Comment | |
|---|---|---|---|---|---|
| current | 14:00, 11 August 2007 |
| 1,425 × 625 (61 KB) | Windupduck | {{Information |Description=This bubble map shows the global distribution of onion and shallot output in 2005 as a percentage of the top producer (China - 19,793,000 tonnes). This map is consistent with incomplete set of data too as long as the top produc |
File usage
No pages on the English Wikipedia use this file (pages on other projects are not listed).
Global file usage
The following other wikis use this file:
- Usage on af.wikipedia.org
- Usage on ast.wikipedia.org
- Usage on cs.wikipedia.org
- Usage on es.wikipedia.org
- Usage on fa.wikipedia.org
- Usage on fr.wikipedia.org
- Usage on he.wikipedia.org
- Usage on is.wikipedia.org
- Usage on it.wikipedia.org
- Usage on ko.wikipedia.org
- Usage on my.wikipedia.org
- Usage on oc.wikipedia.org
- Usage on pl.wikipedia.org
- Usage on si.wikipedia.org
- Usage on ta.wikipedia.org
- Usage on th.wikipedia.org
- Usage on uk.wikipedia.org
- Usage on ur.wikipedia.org
- Usage on vi.wikipedia.org