Size of this preview:
800 × 351 pixels. Other resolutions:
320 × 140 pixels |
640 × 281 pixels |
1,425 × 625 pixels.
Original file (1,425 × 625 pixels, file size: 59 KB, MIME type: image/png)
| This is a file from the
Wikimedia Commons. Information from its
description page there is shown below. Commons is a freely licensed media file repository. You can help. |
Summary
| Description |
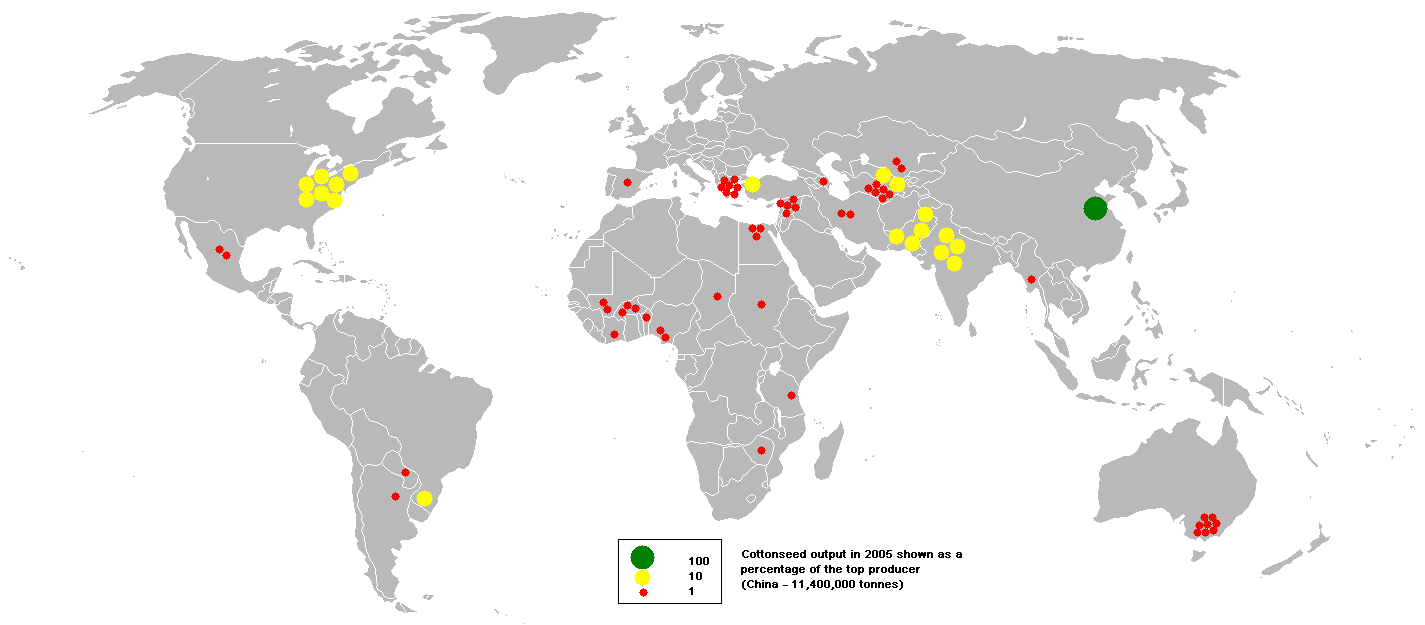
This bubble map shows the global distribution of cottonseed output in 2005 as a percentage of the top producer (China - 11,400,000 tonnes). This map is consistent with incomplete set of data too as long as the top producer is known. It resolves the accessibility issues faced by colour-coded maps that may not be properly rendered in old computer screens. Data was extracted on 18th June 2007 from http://faostat.fao.org/site/336/DesktopDefault.aspx?PageID=336 Based on en:Image:BlankMap-World.png |
| Date | 18 June 2007 (original upload date) |
| Source | Transferred from en.wikipedia to Commons. |
| Author | Anwar saadat at English Wikipedia |
Licensing
| This work has been released into the
public domain by its author,
Anwar saadat at
English Wikipedia. This applies worldwide. In some countries this may not be legally possible; if so: Anwar saadat grants anyone the right to use this work for any purpose, without any conditions, unless such conditions are required by law. |
Original upload log
The original description page was
here. All following user names refer to en.wikipedia.
- 2007-06-18 13:47 Anwar saadat 1425×625×8 (60649 bytes)
File history
Click on a date/time to view the file as it appeared at that time.
| Date/Time | Thumbnail | Dimensions | User | Comment | |
|---|---|---|---|---|---|
| current | 03:47, 30 August 2007 |
| 1,425 × 625 (59 KB) | Shushruth | {{Information |Description=This bubble map shows the global distribution of cottonseed output in 2005 as a percentage of the top producer (China - 11,400,000 tonnes). This map is consistent with incomplete set of data too as long as the top producer is k |
File usage
No pages on the English Wikipedia use this file (pages on other projects are not listed).
Global file usage
The following other wikis use this file:
- Usage on ar.wikipedia.org
- Usage on az.wikipedia.org
- Usage on az.wikiquote.org
- Usage on de.wikipedia.org
- Usage on el.wikipedia.org
- Usage on et.wikipedia.org
- Usage on hu.wikipedia.org
- Usage on ja.wikipedia.org
- Usage on kn.wikipedia.org
- Usage on kw.wikipedia.org
- Usage on sah.wikipedia.org
- Usage on simple.wikipedia.org
- Usage on te.wikipedia.org