
Original file (1,425 × 625 pixels, file size: 60 KB, MIME type: image/png)
| This is a file from the
Wikimedia Commons. Information from its
description page there is shown below. Commons is a freely licensed media file repository. You can help. |
| Description |
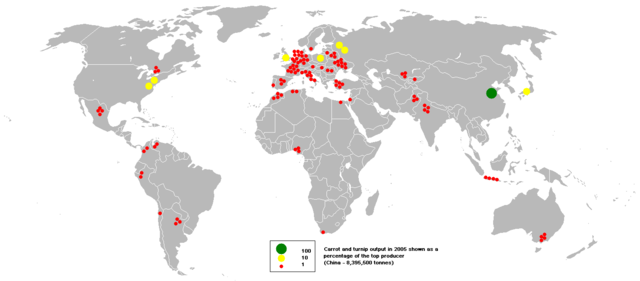
This bubble map shows the global distribution of carrot and turnip output in 2005 as a percentage of the top producer (China - 8,395,500 tonnes). This map is consistent with incomplete set of data too as long as the top producer is known. It resolves the accessibility issues faced by colour-coded maps that may not be properly rendered in old computer screens. Data was extracted on 18th June 2007 from http://faostat.fao.org Based on Image:BlankMap-World.png |
| Date | |
| Source | http://faostat.fao.org |
| Author | en:User:Anwar saadat |
| |
This work has been released into the
public domain by its author,
Anwar saadat, at the
English Wikipedia project. This applies worldwide. In case this is not legally possible: |
File history
Click on a date/time to view the file as it appeared at that time.
| Date/Time | Thumbnail | Dimensions | User | Comment | |
|---|---|---|---|---|---|
| current | 20:55, 8 October 2008 |
| 1,425 × 625 (60 KB) | Cookie | {{Information |Description=This bubble map shows the global distribution of carrot and turnip output in 2005 as a percentage of the top producer (China - 8,395,500 tonnes). This map is consistent with incomplete set of data too as long as the top produce |
File usage
Global file usage
The following other wikis use this file:
- Usage on ar.wikipedia.org
- Usage on ba.wikipedia.org
- Usage on bn.wikipedia.org
- Usage on es.wikipedia.org
- Usage on fa.wikipedia.org
- Usage on fr.wikipedia.org
- Usage on gl.wikipedia.org
- Usage on gu.wikipedia.org
- Usage on mzn.wikipedia.org
- Usage on ru.wikipedia.org