Size of this preview:
720 × 600 pixels. Other resolutions:
288 × 240 pixels |
576 × 480 pixels |
922 × 768 pixels |
1,229 × 1,024 pixels |
2,458 × 2,048 pixels |
3,000 × 2,500 pixels.
Original file (3,000 × 2,500 pixels, file size: 2.02 MB, MIME type: image/png)
| This is a file from the
Wikimedia Commons. Information from its
description page there is shown below. Commons is a freely licensed media file repository. You can help. |
Summary
| Description |
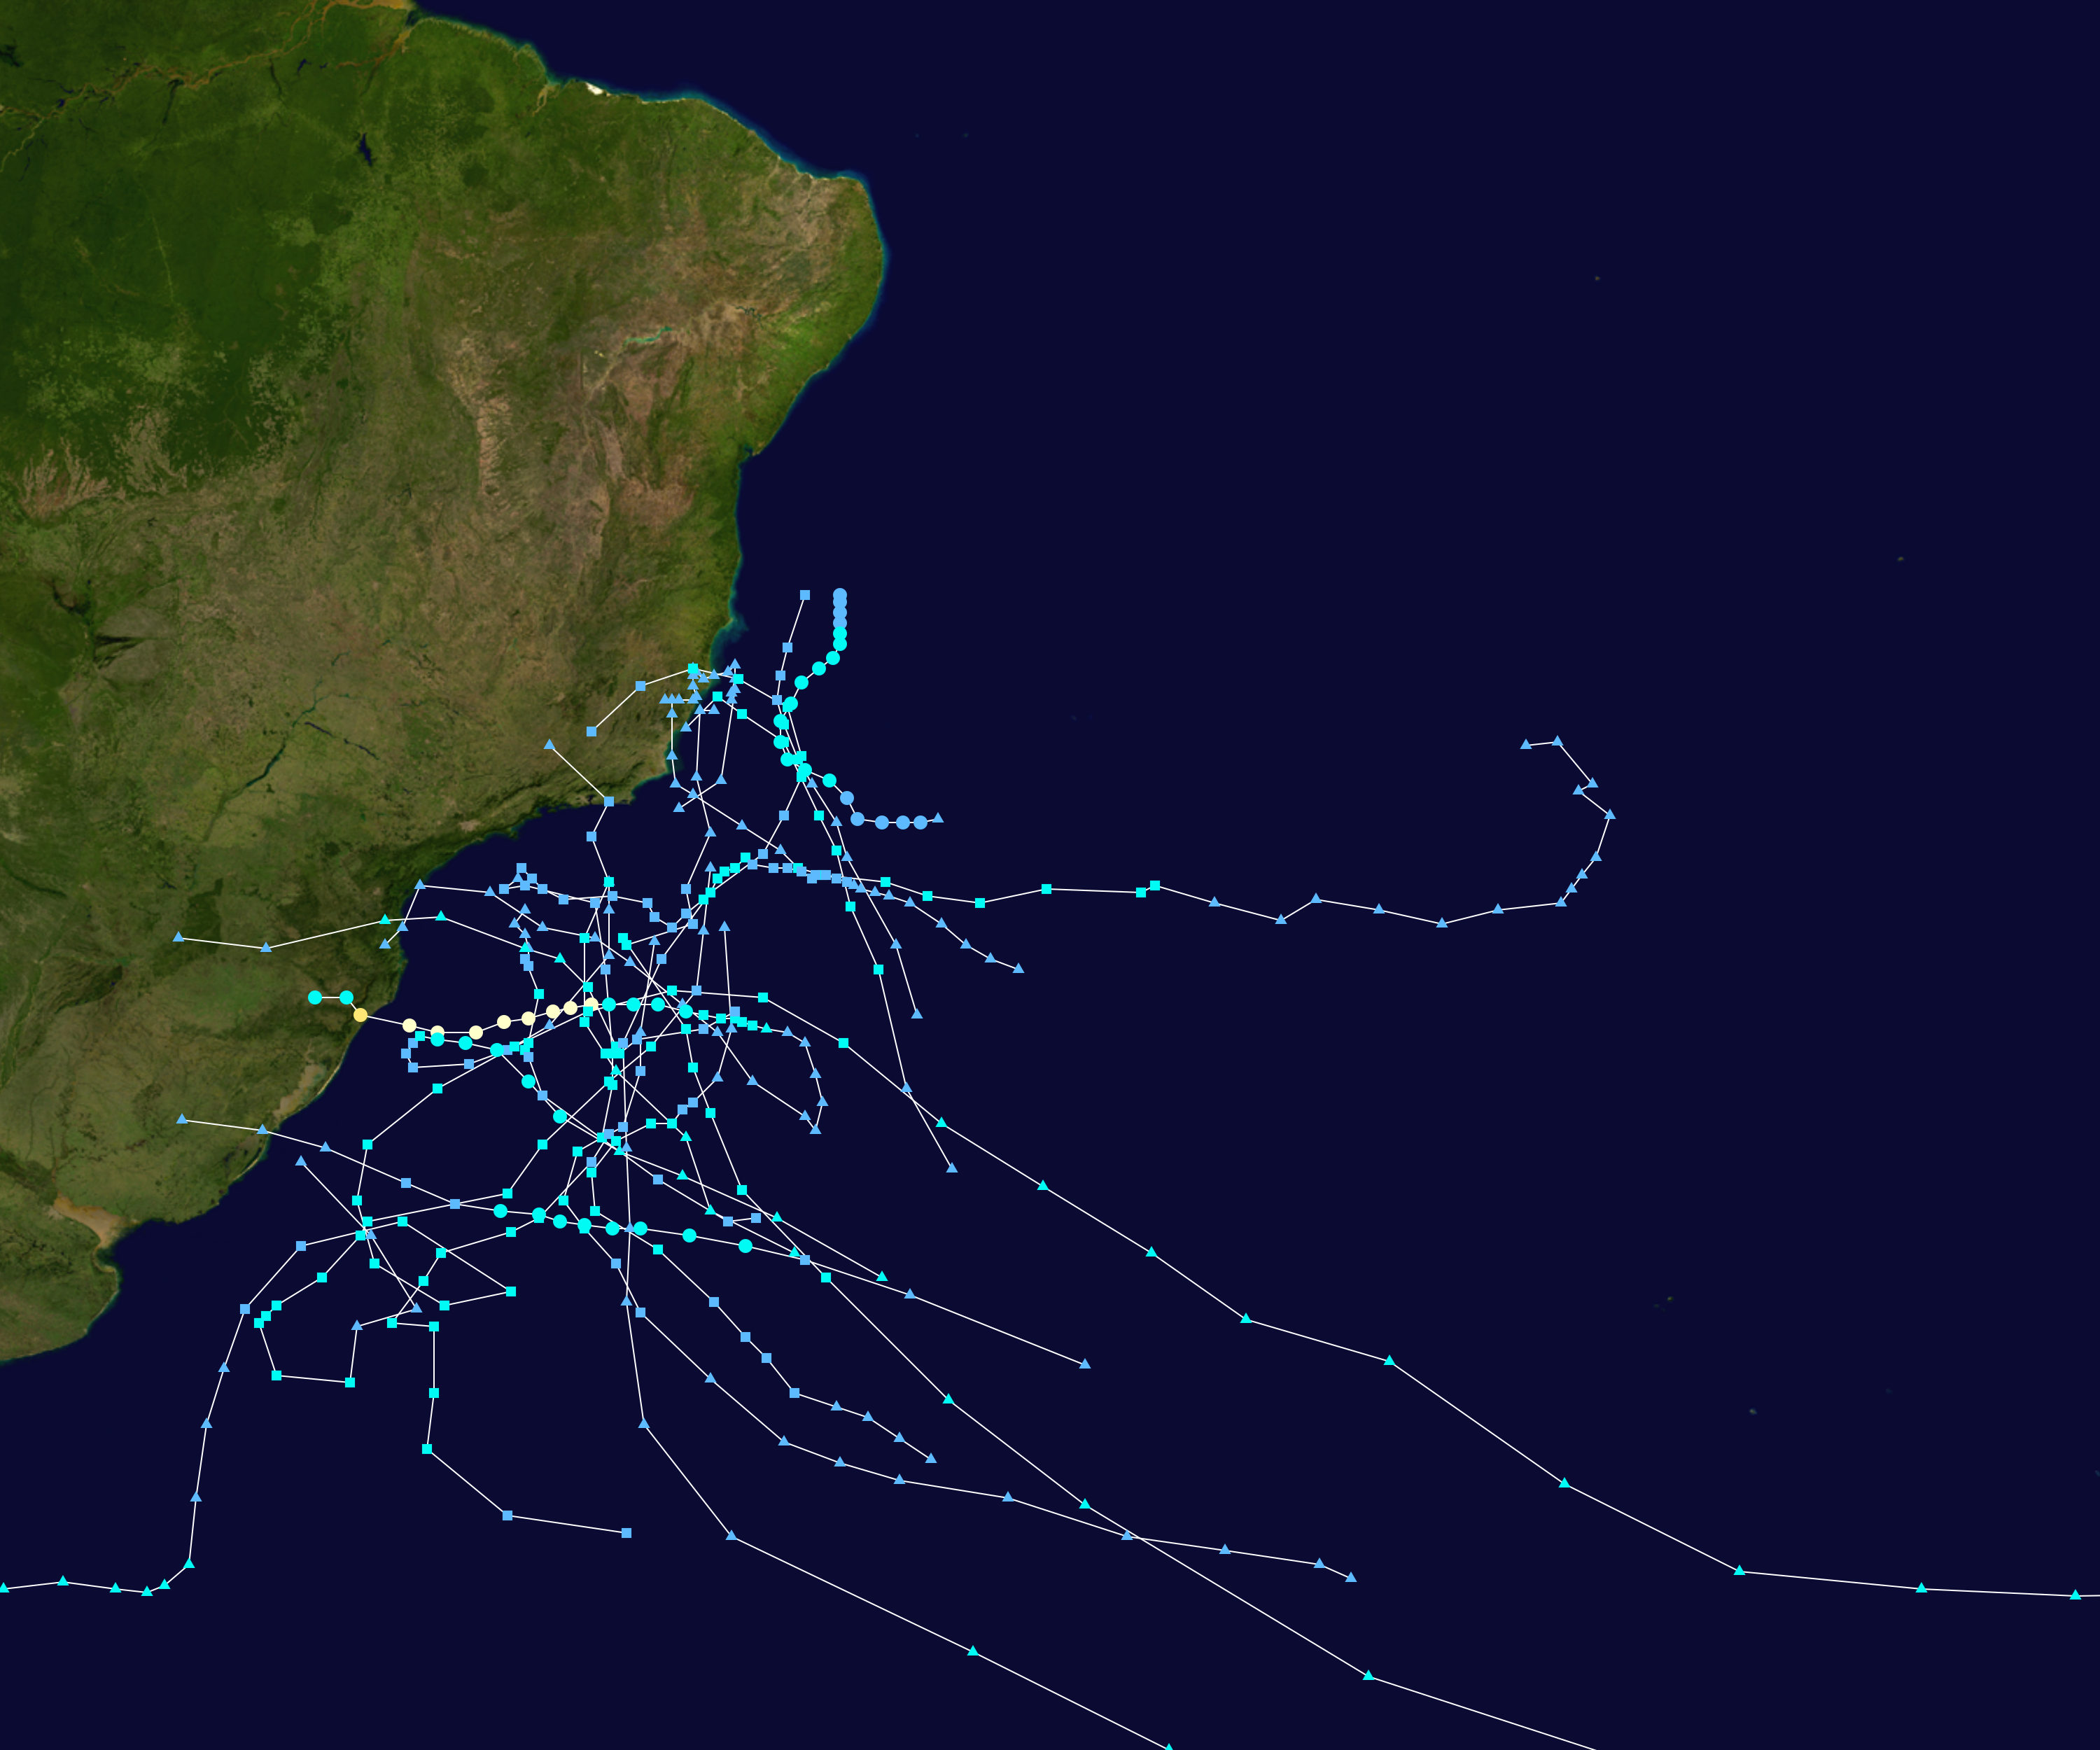
English: Track map of
all significant systems of the
South Atlantic tropical cyclone. The points show the location of the storm at 6-hour intervals. The colour represents the storm's
maximum sustained wind speeds as classified in the (see below), and the shape of the data points represent the nature of the storm, according to the legend below. Tropical depression (≤38 mph, ≤62 km/h)
Tropical storm (39–73 mph, 63–118 km/h)
Category 1 (74–95 mph, 119–153 km/h)
Category 2 (96–110 mph, 154–177 km/h)
Category 3 (111–129 mph, 178–208 km/h)
Category 4 (130–156 mph, 209–251 km/h)
Category 5 (≥157 mph, ≥252 km/h)
Unknown
Storm type |
| Date | 2004-03-19– |
| Source | Created by Meow using Wikipedia:WikiProject Tropical cyclones/Tracks. The background image is from NASA. Tracking data is from Category:South Atlantic tropical cyclone track maps. |
| Author | Meow |

|
This file may be updated to reflect new information. If you wish to use a specific version of the file without new updates being mirrored, please upload the required version as a separate file. |
Licensing
| This work has been released into the
public domain by its author,
Meow. This applies worldwide. In some countries this may not be legally possible; if so: Meow grants anyone the right to use this work for any purpose, without any conditions, unless such conditions are required by law. |
File history
Click on a date/time to view the file as it appeared at that time.
| Date/Time | Thumbnail | Dimensions | User | Comment | |
|---|---|---|---|---|---|
| current | 13:35, 28 November 2022 |
| 3,000 × 2,500 (2.02 MB) | Meow | Yakecan |
| 10:50, 18 May 2022 |
 | 3,000 × 2,500 (1.98 MB) | Meow | Raoni and Ubá | |
| 08:57, 23 June 2021 |
 | 3,000 × 2,500 (2.86 MB) | Meow | 01Q (2021) and Potira | |
| 08:10, 15 February 2021 |
 | 3,000 × 2,500 (2.84 MB) | Meow | Mani and Oquira | |
| 09:38, 2 April 2020 |
 | 3,000 × 2,500 (2.8 MB) | Meow | Kurumí | |
| 02:33, 26 January 2020 |
 | 3,000 × 2,500 (2.78 MB) | Meow | Kurumí | |
| 11:03, 23 May 2019 |
 | 3,000 × 2,500 (2.77 MB) | Meow | Jaguar | |
| 15:18, 30 March 2019 |
 | 3,000 × 2,500 (2.76 MB) | Meow | Iba | |
| 17:01, 22 March 2019 |
 | 4,000 × 3,333 (4.49 MB) | Meow | --res 4000 --dots 0.2 --lines 0.04 --xmin -60 --xmax 0 --ymin -50 --ymax 0 | |
| 15:33, 12 December 2017 |
 | 2,700 × 1,915 (1.67 MB) | Meow | Guará |
File usage
The following pages on the English Wikipedia use this file (pages on other projects are not listed):
- Hurricane Catarina
- List of South America hurricanes
- South Atlantic tropical cyclone
- Subtropical Storm Ubá
- Subtropical Storm Yakecan
- Tropical cyclone basins
- User:Jarda2020/2021–22 South Atlantic hurricane season
- User:Jarda2020/2023 South Atlantic hurricane season
- Template:South Atlantic tropical cyclone
- Draft:List of South Atlantic tropical and subtropical cyclones
Global file usage
The following other wikis use this file:
- Usage on es.wikipedia.org
- Usage on fa.wikipedia.org
- Usage on fr.wikipedia.org
- Usage on ko.wikipedia.org
- Usage on pt.wikipedia.org
- Ciclone Catarina
- Bacia de formação de ciclones tropicais
- Ciclones do Atlântico Sul
- Tempestade tropical Anita
- Tempestade subtropical Bapo
- Tempestade subtropical Cari
- Tempestade subtropical Arani
- Tempestade subtropical Deni
- Tempestade subtropical Eçaí
- Ciclone Guará
- Tempestade tropical Iba
- Predefinição:Ciclone tropical do Atlântico Sul
- Tempestade subtropical Jaguar
- Tempestade subtropical Mani
- Tempestade subtropical Oquira
- Tempestade tropical 01Q
- Tempestade subtropical Potira
- Depressão subtropical 02Q (2021)
- Tempestade subtropical Raoni (Invest N1)
- Tempestade subtropical Ubá
- Tempestade subtropical Yakecan
- Tempestade tropical Akará
- Usage on th.wikipedia.org
- Usage on vi.wikipedia.org
- Usage on zh.wikipedia.org