
Size of this preview:
800 × 495 pixels. Other resolutions:
320 × 198 pixels |
640 × 396 pixels |
1,024 × 633 pixels |
1,280 × 791 pixels |
2,700 × 1,669 pixels.
Original file (2,700 × 1,669 pixels, file size: 1.58 MB, MIME type: image/png)
| This is a file from the
Wikimedia Commons. Information from its
description page there is shown below. Commons is a freely licensed media file repository. You can help. |
Summary
| Description |
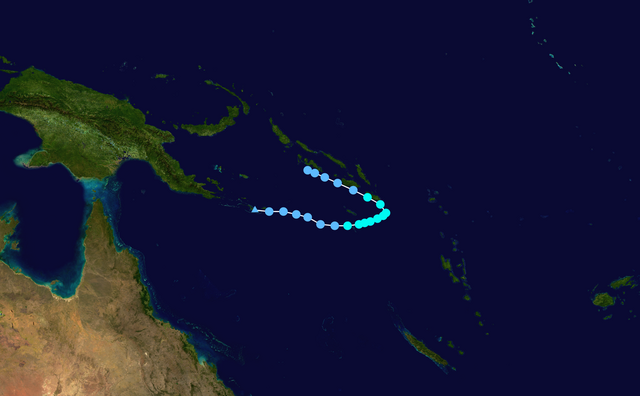
English: Track map of
Tropical Cyclone Liua of the
2018-19 South Pacific cyclone season and the
2018-19 Australian region cyclone season. The points show the location of the storm at 6-hour intervals. The colour represents the storm's
maximum sustained wind speeds as classified in the (see below), and the shape of the data points represent the nature of the storm, according to the legend below. Tropical depression (≤38 mph, ≤62 km/h)
Tropical storm (39–73 mph, 63–118 km/h)
Category 1 (74–95 mph, 119–153 km/h)
Category 2 (96–110 mph, 154–177 km/h)
Category 3 (111–129 mph, 178–208 km/h)
Category 4 (130–156 mph, 209–251 km/h)
Category 5 (≥157 mph, ≥252 km/h)
Unknown
Storm type |
||
| Date | 2018-09-25–2018-09-30 | ||
| Source | Created by Keith Edkins using Wikipedia:WikiProject Tropical cyclones/Tracks. The background image is from NASA. Tracking data is from the Joint Typhoon Warning Center [1]. | ||
| Author | Keith Edkins | ||
| Source code | Track map data table, if present below, is in
HURDAT2 or
ATCF format. See format details in
[2] and
[3], respectively.
|
Licensing
| This work has been released into the
public domain by its author,
Keith Edkins. This applies worldwide. In some countries this may not be legally possible; if so: Keith Edkins grants anyone the right to use this work for any purpose, without any conditions, unless such conditions are required by law. |
File history
Click on a date/time to view the file as it appeared at that time.
| Date/Time | Thumbnail | Dimensions | User | Comment | |
|---|---|---|---|---|---|
| current | 13:58, 7 January 2021 |
| 2,700 × 1,669 (1.58 MB) | Meow | Strict 6-hour track |
| 11:42, 7 January 2021 |
 | 2,700 × 1,669 (1.62 MB) | AveryTheComrade | BT update | |
| 13:46, 10 November 2018 |
 | 2,700 × 1,669 (1.58 MB) | Meow | 10-01 06Z | |
| 16:16, 29 September 2018 |
 | 1,024 × 633 (333 KB) | Keith Edkins | 29/1200z | |
| 12:25, 28 September 2018 |
 | 1,024 × 633 (327 KB) | Keith Edkins | 28/0600z | |
| 21:12, 27 September 2018 |
 | 1,024 × 633 (325 KB) | Keith Edkins | 27/1200z | |
| 18:19, 26 September 2018 |
 | 1,024 × 633 (326 KB) | Keith Edkins | {{Information |Description={{en|Track map of Tropical Depression 01F of the 2018–19 South Pacific cyclone season. The points show the location of the storm at 6-hour intervals. The colour represents the storm's maximum sustained wind speeds as classified in the Saffir-Simpson Hurricane Scale (see below), and the shape of the data points represent the natu... |
File usage
The following pages on the English Wikipedia use this file (pages on other projects are not listed):
Global file usage
The following other wikis use this file:
- Usage on ceb.wikipedia.org
- Usage on de.wikipedia.org
- Usage on ko.wikipedia.org
- Usage on pt.wikipedia.org
- Usage on th.wikipedia.org
- Usage on vi.wikipedia.org
- Usage on zh.wikipedia.org