
Size of this preview:
770 × 600 pixels. Other resolutions:
308 × 240 pixels |
616 × 480 pixels |
1,000 × 779 pixels.
Original file (1,000 × 779 pixels, file size: 44 KB, MIME type: image/png)
| This is a file from the
Wikimedia Commons. Information from its
description page there is shown below. Commons is a freely licensed media file repository. You can help. |
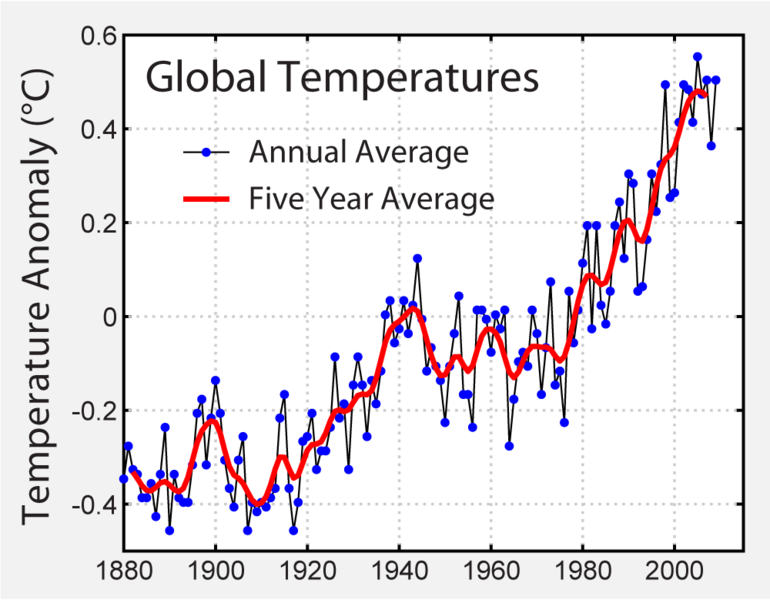
| Description | This image shows the instrumental record of global average w:temperatures as compiled by the w:NASA's w:Goddard Institute for Space Studies. (2006) "Global temperature change". Proc. Natl. Acad. Sci. 103: 14288-14293. Following the common practice of the w:IPCC, the zero on this figure is the mean temperature from 1961-1990. This figure was originally prepared by Robert A. Rohde from publicly available data and is incorporated into the Global Warming Art project. | |||
| Source | http://data.giss.nasa.gov/gistemp/graphs/ | |||
| Author | ||||
| Other versions |
Derivative works of this file:
|

.svg)
Image from Global Warming Art
This image is an original work created for
Global Warming Art. Please refer to the
image description page for more information.

|
Permission is granted to copy, distribute and/or modify this document under the terms of the GNU Free Documentation License, Version 1.2 or any later version published by the Free Software Foundation; with no Invariant Sections, no Front-Cover Texts, and no Back-Cover Texts. A copy of the license is included in the section entitled GNU Free Documentation License. |
| This file is licensed under the Creative Commons Attribution-Share Alike 3.0 Unported license. | ||
| ||
| This licensing tag was added to this file as part of the GFDL licensing update. |
| Dragons flight's Temperature Record Series |
| This figure is part of a series of plots created by
Dragons flight to illustrate changes in Earth's temperature and climate across many different time scales. |
| Time Period: 25 yrs | 150 yrs | 1 kyr | 2 kyr | 12 kyr | 450 kyr | 5 Myr | 65 Myr | 500 Myr |
| For articles related to this topic see: Temperature record |
File history
Click on a date/time to view the file as it appeared at that time.
| Date/Time | Thumbnail | Dimensions | User | Comment | |
|---|---|---|---|---|---|
| current | 00:51, 20 February 2010 |
| 1,000 × 779 (44 KB) | Dragons flight | update to 2009 |
| 03:54, 4 February 2009 |
 | 800 × 591 (39 KB) | Dragons flight | update to 2008, change to GISS data | |
| 07:48, 21 February 2008 |
 | 800 × 593 (41 KB) | Dragons flight | update to 2007 | |
| 22:01, 2 September 2005 |
 | 525 × 390 (42 KB) | Wisty~commonswiki | Global warming picture from wikipedia |
File usage
More than 100 pages use this file. The following list shows the first 100 pages that use this file only. A full list is available.
- Talk:2006 Atlantic hurricane season/Archive 2
- Talk:Climate change/Archive 14
- Talk:Climate change/Archive 35
- Talk:Climate change/Archive 37
- Talk:Climate change/Archive 39
- Talk:Climate change/Archive 40
- Talk:Climate change/Archive 59
- Talk:Climate change/Archive 61
- Talk:Retreat of glaciers since 1850/Archive 3
- User:Abrightexhalation
- User:Agucova
- User:Amandavcg
- User:AngelChavezCo
- User:AngelChavezCo/Userboxes
- User:Art Carlson
- User:AstroHurricane001/Userboxes
- User:Bduke
- User:Bobbylon
- User:Bouncingnewsgreen
- User:C. J. T. T. Wilson
- User:Carturo222
- User:Cirripedius
- User:Cjeam
- User:Cynthisa
- User:Despotak
- User:Dingsuntil
- User:Dingsuntil/u/ClimateChange
- User:Dragons flight/Images
- User:EdwardLane
- User:Ehershkovitz
- User:Fahdq
- User:Finereach/United Kingdom climate change programme
- User:Gacurr
- User:Gdeblois19
- User:Gotrees4
- User:Gudzwabofer
- User:Guoruei
- User:Gyakutendesu
- User:Halimahart
- User:Intellectualyo
- User:IoYo
- User:JFoog
- User:JosVan
- User:Kaylon Sphere
- User:Kurtis/Userboxes
- User:Kyerjay/Overflow userboxes
- User:Licks-rocks
- User:M8TG
- User:MachinaLabs
- User:Mporter/Climate data
- User:Mpprogram6771
- User:Mwheatland
- User:Mytwocents/Globalnull Warmingnull
- User:NefariousPhD
- User:Pastel kitten
- User:Perqua
- User:PseudoscienceFTL
- User:RadicalOne/UBX Design
- User:RadicalOne/UBX Design/ClimateChange
- User:Raul654/archive11
- User:Realtavirtuale
- User:Rolf Schmidt
- User:Rosalieroxx/testing
- User:Rsue9334
- User:RuleTheWiki
- User:Ryttu3k
- User:Samsmachado
- User:Saukkomies/My userboxes
- User:ShadowBobcat10
- User:Sixty Minute Limit/Userboxes
- User:Spark1498
- User:Spartacus106
- User:Srpbm
- User:Stephenpratt
- User:TNstingray
- User:Tardispower
- User:TheOneAndOnlyMuffinCat
- User:The Average Wikipedian
- User:Therealelizacat
- User:Ts1and2fanatic
- User:UBeR/GWcleanup
- User:Universal Life
- User:Vancemiller
- User:Vaygunwitharaygun
- User:Wikip rhyre/UBX playground
- User:Wil540 art
- User:Yobbin
- User:Zellfaze
- User:Zemoxian
- User talk:Bender235/2008 archive
- User talk:Lar/Archive 69
- Wikipedia:General sanctions/Climate change probation/Requests for enforcement/Archive10
- Wikipedia:Reference desk/Archives/Science/2006 November 12
- Wikipedia:Reference desk/Archives/Science/2006 November 27
- Wikipedia:Reference desk/Archives/Science/2009 September 17
- Wikipedia:Userboxes/Science/Physical
- Wikipedia talk:In the news/Archive 13
- File talk:Instrumental Temperature Record.png
- Template talk:WikiProject Energy
- Portal:Environment/Selected article
View more links to this file.
Global file usage
The following other wikis use this file:
- Usage on ca.wikipedia.org
- Usage on ca.wikibooks.org
- Usage on ceb.wikipedia.org
- Usage on en.wikibooks.org
- Usage on en.wikinews.org
- Usage on es.wikipedia.org
- Usage on eu.wikipedia.org
- Usage on fr.wikipedia.org
- Usage on fr.wikiversity.org
- Usage on hu.wikipedia.org
- Usage on hy.wikipedia.org
- Usage on it.wikipedia.org
- Usage on ja.wikipedia.org
- Usage on kn.wikipedia.org
- Usage on lt.wikipedia.org
- Usage on mn.wikipedia.org
- Usage on pl.wikiquote.org
- Usage on pt.wikipedia.org
- Usage on ru.wikipedia.org
- Usage on sq.wikipedia.org
- Usage on sv.wikipedia.org
- Usage on ta.wikipedia.org
- Usage on test.wikipedia.org
- Usage on th.wikipedia.org
- Usage on zh-classical.wikipedia.org
- Usage on zh-min-nan.wikipedia.org
- Usage on zh.wikipedia.org