
Size of this preview:
800 × 494 pixels. Other resolutions:
320 × 198 pixels |
640 × 395 pixels |
1,024 × 633 pixels |
1,280 × 791 pixels |
2,700 × 1,668 pixels.
Original file (2,700 × 1,668 pixels, file size: 3.56 MB, MIME type: image/png)
| This is a file from the
Wikimedia Commons. Information from its
description page there is shown below. Commons is a freely licensed media file repository. You can help. |
Summary
| Description |
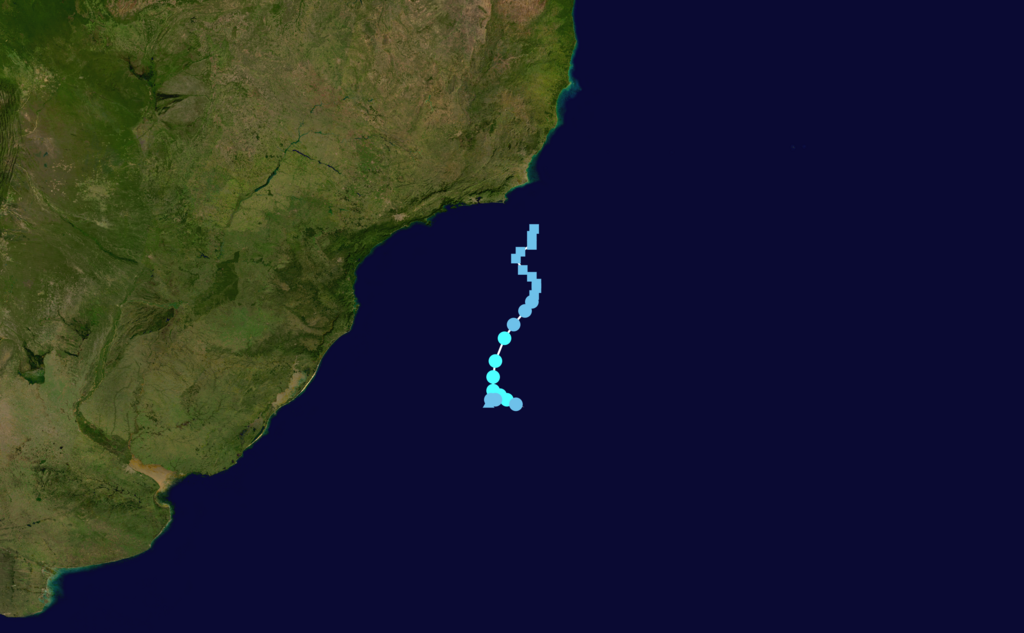
English: Track map of
Tropical storm Akará of the
South Atlantic tropical cyclone. The points show the location of the storm at 6-hour intervals. The colour represents the storm's
maximum sustained wind speeds as classified in the (see below), and the shape of the data points represent the nature of the storm, according to the legend below. Tropical depression (≤38 mph, ≤62 km/h)
Tropical storm (39–73 mph, 63–118 km/h)
Category 1 (74–95 mph, 119–153 km/h)
Category 2 (96–110 mph, 154–177 km/h)
Category 3 (111–129 mph, 178–208 km/h)
Category 4 (130–156 mph, 209–251 km/h)
Category 5 (≥157 mph, ≥252 km/h)
Unknown
Storm type |
| Date | 2024-02-16–2024-02-22 |
| Source | Created by 2003 LN6 using Wikipedia:WikiProject Tropical cyclones/Tracks. The background image is from NASA. Tracking data is from https://australiasevereweather.com/cyclones/2024/trak2402.htm. |
| Author | 2003 LN6 |
Licensing
| This work has been released into the
public domain by its author,
2003 LN6. This applies worldwide. In some countries this may not be legally possible; if so: 2003 LN6 grants anyone the right to use this work for any purpose, without any conditions, unless such conditions are required by law. |
Licensing
I, the copyright holder of this work, hereby publish it under the following license:
This file is licensed under the
Creative Commons
Attribution 4.0 International license.
- You are free:
- to share – to copy, distribute and transmit the work
- to remix – to adapt the work
- Under the following conditions:
- attribution – You must give appropriate credit, provide a link to the license, and indicate if changes were made. You may do so in any reasonable manner, but not in any way that suggests the licensor endorses you or your use.
File history
Click on a date/time to view the file as it appeared at that time.
| Date/Time | Thumbnail | Dimensions | User | Comment | |
|---|---|---|---|---|---|
| current | 18:40, 13 May 2024 |
| 2,700 × 1,668 (3.56 MB) | 2003 LN6 | {{WPTC track map | author = 2003 LN6 | name = Tropical storm Akará | season = South Atlantic tropical cyclone |colors=new | start = 2024-02-16 | end = 2024-02-22 | othersource = https://australiasevereweather.com/cyclones/2024/trak2402.htm | catname = Tropical Storm Akará (2024) }} =={{int:license-header}}== {{self|cc-by-4.0}} Category:South Atlantic tropical cyclone track maps |
File usage
The following pages on the English Wikipedia use this file (pages on other projects are not listed):