Deenwood, Georgia | |
|---|---|
 Location in
Ware County and the state of
Georgia | |
| Coordinates: 31°14′20″N 82°22′18″W / 31.23889°N 82.37167°W | |
| Country | United States |
| State | Georgia |
| County | Ware |
| Area | |
| • Total | 3.39 sq mi (8.77 km2) |
| • Land | 3.35 sq mi (8.69 km2) |
| • Water | 0.03 sq mi (0.09 km2) |
| Elevation | 135 ft (41 m) |
| Population (
2020) | |
| • Total | 2,207 |
| • Density | 658.02/sq mi (254.09/km2) |
| Time zone | UTC-5 ( Eastern (EST)) |
| • Summer ( DST) | UTC-4 (EDT) |
| FIPS code | 13-22080 [2] |
| GNIS feature ID | 0357663 [3] |
Deenwood is an unincorporated community and census-designated place (CDP) in Ware County, Georgia, United States. The population was 2,207 at the 2020 census. It is part of the Waycross micropolitan statistical area. Deenwood Baptist Church is named after this geographical area.
Geography
Deenwood is located at 31°14′20″N 82°22′18″W / 31.23889°N 82.37167°W (31.238993, -82.371540). [4]
According to the United States Census Bureau, the CDP has a total area of 3.4 square miles (8.8 km2), all land.
Climate
The climate in this area is characterized by relatively high temperatures and evenly distributed precipitation throughout the year. According to the Köppen Climate Classification system, Deenwood has a humid subtropical climate, abbreviated "Cfa" on climate maps. [5]
| Climate data for Deenwood, Georgia | |||||||||||||
|---|---|---|---|---|---|---|---|---|---|---|---|---|---|
| Month | Jan | Feb | Mar | Apr | May | Jun | Jul | Aug | Sep | Oct | Nov | Dec | Year |
| Mean daily maximum °C (°F) | 16 (60) |
19 (66) |
22 (71) |
26 (78) |
29 (84) |
32 (89) |
33 (91) |
32 (89) |
30 (86) |
26 (78) |
22 (71) |
17 (62) |
25 (77) |
| Mean daily minimum °C (°F) | 4 (39) |
6 (42) |
9 (48) |
12 (53) |
16 (60) |
20 (68) |
21 (69) |
21 (69) |
19 (66) |
14 (57) |
9 (48) |
5 (41) |
13 (55) |
| Average precipitation mm (inches) | 130 (5.1) |
97 (3.8) |
110 (4.5) |
48 (1.9) |
56 (2.2) |
130 (5.2) |
140 (5.7) |
180 (7.1) |
110 (4.2) |
89 (3.5) |
76 (3) |
74 (2.9) |
1,250 (49.2) |
| Source: Weatherbase [6] | |||||||||||||
Demographics
| Census | Pop. | Note | %± |
|---|---|---|---|
| 1970 | 3,015 | — | |
| 1980 | 3,580 | 18.7% | |
| 1990 | 2,055 | −42.6% | |
| 2000 | 1,836 | −10.7% | |
| 2010 | 2,146 | 16.9% | |
| 2020 | 2,207 | 2.8% | |
| U.S. Decennial Census
[7] 1850-1870 [8] 1870-1880 [9] 1890-1910 [10] 1920-1930 [11] 1940 [12] 1950 [13] 1960 [14] 1970 [15] 1980 [16] 1990 [17] 2000 [18] 2010 [19] 2020 [20] | |||
It was first listed as an unincorporated community in 1970 and designated a CDP in 1980. [16]
2020
| Race / Ethnicity | Pop 2000 [21] | Pop 2010 [19] | Pop 2020 [20] | % 2000 | % 2010 | % 2020 |
|---|---|---|---|---|---|---|
| White alone (NH) | 1,672 | 1,735 | 1,605 | 91.07% | 80.85% | 72.72% |
| Black or African American alone (NH) | 134 | 309 | 405 | 7.30% | 14.40% | 18.35% |
| Native American or Alaska Native alone (NH) | 0 | 4 | 3 | 0.00% | 0.19% | 0.14% |
| Asian alone (NH) | 10 | 26 | 30 | 0.54% | 1.21% | 1.36% |
| Pacific Islander alone (NH) | 2 | 0 | 0 | 0.11% | 0.00% | 0.00% |
| Some Other Race alone (NH) | 2 | 0 | 13 | 0.11% | 0.00% | 0.59% |
| Mixed race or Multiracial (NH) | 3 | 39 | 72 | 0.16% | 1.82% | 3.26% |
| Hispanic or Latino (any race) | 13 | 33 | 79 | 0.71% | 1.54% | 3.58% |
| Total | 1,836 | 2,146 | 2,207 | 100.00% | 100.00% | 100.00% |
In 1990, the population was 2,055. [22] At the 2020 census, its population grew to 2,207.
References
- ^ "2020 U.S. Gazetteer Files". United States Census Bureau. Retrieved December 18, 2021.
- ^ "U.S. Census website". United States Census Bureau. Retrieved 2008-01-31.
- ^ "US Board on Geographic Names". United States Geological Survey. 2007-10-25. Retrieved 2008-01-31.
- ^ "US Gazetteer files: 2010, 2000, and 1990". United States Census Bureau. 2011-02-12. Retrieved 2011-04-23.
- ^ Climate Summary for Deenwood, Georgia
- ^ "Weatherbase.com". Weatherbase. 2013. Retrieved on September 28, 2013.
- ^ "Decennial Census of Population and Housing by Decade". United States Census Bureau.
- ^ "1870 Census of Population - Georgia - Population of Civil Divisions less than Counties" (PDF). United States Census Bureau. 1870.
- ^ "1880 Census of Population - Georgia - Population of Civil Divisions less than Counties" (PDF). United States Census Bureau. 1880.
- ^ "1910 Census of Population - Georgia" (PDF). United States Census Bureau. 1930.
- ^ "1930 Census of Population - Georgia" (PDF). United States Census Bureau. 1930. pp. 251–256.
- ^ "1940 Census of Population - Georgia" (PDF). United States Census Bureau. 1940.
- ^ "1950 Census of Population - Georgia" (PDF). United States Census Bureau. 1980.
- ^ "1960 Census of Population - Population of County Subdivisions - Georgia" (PDF). United States Census Bureau. 1960.
- ^ "1970 Census of Population - Population of County Subdivisions - Georgia" (PDF). United States Census Bureau. 1970.
- ^ a b "1980 Census of Population - Number of Inhabitants - Georgia" (PDF). United States Census Bureau. 1980.
- ^ "1990 Census of Population - Summary Social, Economic, and Housing Characteristics - Georgia" (PDF). United States Census Bureau. 1990.
- ^ "2000 Census of Population - General Population Characteristics - Georgia" (PDF). United States Census Bureau. 2000.
- ^ a b "P2: Hispanic or Latino, and Not Hispanic or Latino by Race – 2010: DEC Redistricting Data (PL 94-171) – Deenwood CDP, Georgia". United States Census Bureau.
- ^ a b "P2: Hispanic or Latino, and Not Hispanic or Latino by Race – 2020: DEC Redistricting Data (PL 94-171) – Deenwood CDP, Georgia". United States Census Bureau.
- ^ "P004 Hispanic or Latino, and Not Hispanic or Latino by Race – 2000: DEC Summary File 1 – Deenwood CDP, Georgia". United States Census Bureau.
- ^ "Index of /library/publications/decennial/1990/cp-1". www2.census.gov. Retrieved 2023-02-16.
Municipalities and communities of
Ware County, Georgia, United States | ||
|---|---|---|
| City | 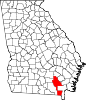 | |
| CDPs | ||
|
Other unincorporated communities | ||
| Footnotes | ‡This populated place also has portions in an adjacent county or counties | |