Calhoun County | |
|---|---|

Calhoun County Courthouse and Confederate Monument | |
 Flag  Seal | |
| Motto: "In the Heart of South Carolina" | |
 Location within the U.S. state of
South Carolina | |
 South Carolina's location within the
U.S. | |
| Coordinates: 33°40′N 80°47′W / 33.67°N 80.78°W | |
| Country | |
| State | |
| Founded | 1908 |
| Named for | John C. Calhoun |
| Seat | St. Matthews |
| Largest community | St. Matthews |
| Area | |
| • Total | 392.48 sq mi (1,016.5 km2) |
| • Land | 381.15 sq mi (987.2 km2) |
| • Water | 11.33 sq mi (29.3 km2) 2.89% |
| Population (
2020) | |
| • Total | 14,119 |
| • Estimate (2023) | 14,186 |
| • Density | 37.04/sq mi (14.30/km2) |
| Time zone | UTC−5 ( Eastern) |
| • Summer ( DST) | UTC−4 ( EDT) |
| Congressional district | 6th |
| Website |
calhouncounty |
Calhoun County is a county in the U.S. state of South Carolina. As of the 2020 census, its population was 14,119, [1] making it the third-least populous county in the state. Its county seat is St. Matthews. In terms of land area, it is also the smallest county in the state. [2]
Located in a rural upland area long devoted to cotton plantations, part of the Black Belt of the South, the county was formed in 1908 from portions of Lexington and Orangeburg counties. It is named for John C. Calhoun, the former U.S. vice-president, Senator, Representative and cabinet member from South Carolina, [3] although Calhoun was from nearby Abbeville, South Carolina.
Calhoun County is part of the Columbia, SC Metropolitan Statistical Area. It has an overall score of 52 including factors health, crime, equity, education, and housing. [4] It is one of 11 counties with the same name in the United States.
History
Calhoun County was home to the Congaree Tribe. As early as 1715 maps show them living in the region. As well, arrowheads and other artifacts continue to be found in lakes and near rivers. [5]
During the American Revolutionary War, Calhoun County was home to the famous Siege of Fort Motte. The Fort Motte Battle Site is accessible today. [6]
As of 2011, Calhoun County contained an illegal dumping of an estimated 250,000 vehicle tires, a mound of tires so large it could reportedly be seen from space. [7]
Geography
According to the U.S. Census Bureau, the county has a total area of 392.48 square miles (1,016.5 km2), of which 381.15 square miles (987.2 km2) is land and 11.33 square miles (29.3 km2) (2.89%) is water. [8] It is the second-smallest county in South Carolina by land area and smallest by total area.
Calhoun County includes features such as Lake Marion, and the Congaree Bluffs, accessible publicly via the Congaree Bluffs Heritage Preserve. [9]
Calhoun County borders Congaree National Park, the only Federally recognized Park which is a Swamp. Astonishing biodiversity exists in Congaree National Park, the largest intact expanse of old growth bottomland hardwood forest remaining in the southeastern United States. Waters from the Congaree and Wateree Rivers sweep through the floodplain, carrying nutrients and sediments that nourish and rejuvenate this ecosystem and support the growth of national and state champion trees. [10] Although the park lies outside the boundaries of Calhoun County, much of the environment is similar.
The upper boundary for Calhoun County is the Congaree River.
State and local protected area
Major water bodies
Adjacent counties
- Richland County – north
- Sumter County – northeast
- Clarendon County – east
- Orangeburg County – south
- Lexington County – northwest
Major highways
Calhoun County is part of the evacuation route for Hurricanes and coastal flooding. During such times there are lane reversals where interstate highway I-26 goes in one direction (northwest). [12]
Demographics
| Census | Pop. | Note | %± |
|---|---|---|---|
| 1910 | 16,634 | — | |
| 1920 | 18,384 | 10.5% | |
| 1930 | 16,707 | −9.1% | |
| 1940 | 16,229 | −2.9% | |
| 1950 | 14,753 | −9.1% | |
| 1960 | 12,256 | −16.9% | |
| 1970 | 10,780 | −12.0% | |
| 1980 | 12,206 | 13.2% | |
| 1990 | 12,753 | 4.5% | |
| 2000 | 15,185 | 19.1% | |
| 2010 | 15,175 | −0.1% | |
| 2020 | 14,119 | −7.0% | |
| 2023 (est.) | 14,186 | [1] | 0.5% |
| U.S. Decennial Census
[13] 1790–1960 [14] 1900–1990 [15] 1990–2000 [16] 2010 [17] 2020 [1] | |||
2020 census
| Race | Num. | Perc. |
|---|---|---|
| White (non-Hispanic) | 7,783 | 55.12% |
| Black or African American (non-Hispanic) | 5,361 | 37.97% |
| Native American | 62 | 0.44% |
| Asian | 27 | 0.19% |
| Pacific Islander | 6 | 0.04% |
| Other/Mixed | 393 | 2.78% |
| Hispanic or Latino | 487 | 3.45% |
As of the 2020 census, there were 14,119 people, 6,179 households, and 3,910 families residing in the county.
2017 census estimate
At the 2017 census estimate, Calhoun County had a population of 14,000 people with a median age of 45.9 and a median household income of $44,010. Between 2016 and 2017 the population of Calhoun County declined from 14,886 to 14,808, a -0.524% decrease and its median household income grew from $42,779 to $44,010, a 2.88% increase. The population of Calhoun County is 53.6% White Alone, 41.6% Black or African American Alone, and 3.58% Hispanic or Latino. 98.3% are U.S. citizens. The median property value in Calhoun County is $103,900, and the homeownership rate is 79.3%. Most people in Calhoun Countycommute by Drove Alone, and the average commute time is 27.2 minutes. The average car ownership in Calhoun County is 2 cars per household. [19]
2010 census
At the 2010 census, there were 15,175 people, 6,080 households, and 4,204 families living in the county. [20] [17] The population density was 39.8 inhabitants per square mile (15.4/km2). There were 7,340 housing units at an average density of 19.3 units per square mile (7.5 units/km2). [21] The racial makeup of the county was 53.9% white, 42.6% black or African American, 0.3% American Indian, 0.2% Asian, 0.1% Pacific islander, 1.8% from other races, and 1.2% from two or more races. Those of Hispanic or Latino origin made up 3.0% of the population. [20] In terms of ancestry, respondents identified as 42.6% of African American (which may include European ancestry; 15.4% American, 14.9% German, 8.5% Irish, and 7.1% of English heritage. [22]
Of the 6,080 households, 30.3% had children under the age of 18 living with them, 48.6% were married couples living together, 15.9% had a female householder with no husband present, 30.9% were non-families, and 26.8% of all households were made up of individuals. The average household size was 2.47 and the average family size was 2.99. The median age was 43.4 years. [20]
The median income for a household in the county was $36,790 and the median income for a family was $51,975. Males had a median income of $42,394 versus $31,001 for females. The per capita income for the county was $20,845. About 11.6% of families and 15.8% of the population were below the poverty line, including 22.4% of those under age 18 and 15.6% of those age 65 or over. [23]
2000 census
At the 2000 census, [24] there were 15,185 people, 5,917 households, and 4,272 families living in the county. The population density was 40 people per square mile (15 people/km2). There were 6,864 housing units at an average density of 18 units per square mile (6.9 units/km2). The racial makeup of the county was 50.03% White, 48.69% Black or African American, 0.19% Native American, 0.14% Asian, 0.03% Pacific Islander, 0.24% from other races, and 0.69% from two or more races. 1.40% of the population were Hispanic or Latino of any race.
There were 5,917 households, out of which 30.20% had children under the age of 18 living with them, 52.00% were married couples living together, 15.80% had a female householder with no husband present, and 27.80% were non-families. 24.50% of all households were made up of individuals, and 9.60% had someone living alone who was 65 years of age or older. The average household size was 2.54 and the average family size was 3.03.
In the county, the population was spread out, with 25.10% under the age of 18, 7.40% from 18 to 24, 27.00% from 25 to 44, 26.70% from 45 to 64, and 13.80% who were 65 years of age or older. The median age was 39 years. For every 100 females, there were 90.10 males. For every 100 females age 18 and over, there were 86.40 males.
The median income for a household in the county was $32,736, and the median income for a family was $39,823. Males had a median income of $31,431 versus $22,267 for females. The per capita income for the county was $17,446. About 13.20% of families and 16.20% of the population were below the poverty line, including 20.40% of those under age 18 and 18.30% of those age 65 or over.
Government and politics
The county government is a five-member council, elected from single-member districts. At the first meeting of the year, they choose a chairperson for the term; it is a rotating position. [25]
Other elected positions in the county are Sheriff, Auditor, Coroner, Treasurer, and Clerk of Court. appointed positions are Coroner and Probate Judge. [25]
Calhoun County Library is a historic library building located at St. Matthews, Calhoun County. It was built about 1877, and is a one-story, medium-gabled white clapboard structure in the Greek Revival style. It was originally built as a residence, but was adapted for use as a county library in 1949.
In the 21st century, the county has leaned Democratic in gubernatorial elections (with 2022 being the only exception), but in presidential elections the county leans Republican (with exceptions in 2008 and 2012).
| Year | Republican | Democratic | Third party | |||
|---|---|---|---|---|---|---|
| No. | % | No. | % | No. | % | |
| 2020 | 4,305 | 51.92% | 3,905 | 47.10% | 81 | 0.98% |
| 2016 | 3,787 | 50.17% | 3,573 | 47.33% | 189 | 2.50% |
| 2012 | 3,707 | 47.32% | 4,045 | 51.63% | 82 | 1.05% |
| 2008 | 3,695 | 47.75% | 3,970 | 51.31% | 73 | 0.94% |
| 2004 | 3,448 | 49.83% | 3,393 | 49.04% | 78 | 1.13% |
| 2000 | 3,216 | 50.46% | 3,063 | 48.06% | 94 | 1.47% |
| 1996 | 2,520 | 45.02% | 2,716 | 48.52% | 362 | 6.47% |
| 1992 | 2,418 | 41.85% | 2,770 | 47.94% | 590 | 10.21% |
| 1988 | 2,585 | 54.00% | 2,175 | 45.44% | 27 | 0.56% |
| 1984 | 2,742 | 53.83% | 2,315 | 45.45% | 37 | 0.73% |
| 1980 | 1,767 | 45.86% | 2,043 | 53.02% | 43 | 1.12% |
| 1976 | 1,382 | 39.87% | 2,055 | 59.29% | 29 | 0.84% |
| 1972 | 1,867 | 60.91% | 1,148 | 37.46% | 50 | 1.63% |
| 1968 | 885 | 28.74% | 1,216 | 39.49% | 978 | 31.76% |
| 1964 | 1,591 | 72.22% | 612 | 27.78% | 0 | 0.00% |
| 1960 | 852 | 61.38% | 536 | 38.62% | 0 | 0.00% |
| 1956 | 146 | 12.37% | 341 | 28.90% | 693 | 58.73% |
| 1952 | 1,107 | 74.25% | 384 | 25.75% | 0 | 0.00% |
| 1948 | 4 | 0.45% | 36 | 4.09% | 841 | 95.46% |
| 1944 | 1 | 0.15% | 602 | 87.76% | 83 | 12.10% |
| 1940 | 3 | 0.45% | 657 | 99.55% | 0 | 0.00% |
| 1936 | 1 | 0.12% | 821 | 99.88% | 0 | 0.00% |
| 1932 | 10 | 1.42% | 694 | 98.58% | 0 | 0.00% |
| 1928 | 7 | 1.20% | 577 | 98.80% | 0 | 0.00% |
| 1924 | 5 | 0.83% | 593 | 99.00% | 1 | 0.17% |
| 1920 | 41 | 6.10% | 631 | 93.90% | 0 | 0.00% |
| 1916 | 41 | 5.52% | 665 | 89.50% | 37 | 4.98% |
| 1912 | 15 | 3.05% | 460 | 93.69% | 16 | 3.26% |
Economy
Although much of Calhoun County is rural, there are many factories including Devro, a UK company that makes sausage casings. [27] Other factories include Starbucks (Roasting Facility), DAK Americas, Zeus Industrial Products, Fitts Co Inc, and Thermo King Columbia, Inc. In the same part of the county Country Clear, Inc. produces bottled water. [28]
Calhoun County offers the Calhoun County I-26 Industrial Park for businesses. [29]
Communities
Towns
- Cameron
- St. Matthews (county seat and largest community)
Unincorporated communities
See also
- List of counties in South Carolina
- National Register of Historic Places listings in Calhoun County, South Carolina
References
- ^ a b c "QuickFacts: Calhoun County, South Carolina". United States Census Bureau. Retrieved March 22, 2024.
- ^ "Find a County". National Association of Counties. Archived from the original on May 31, 2011. Retrieved June 7, 2011.
- ^ Federal Writers' Project (1941). Palmetto Place Names. Sloane Printing Co. p. 12.
- ^ US News & World Report, University of Missouri Center for Applied Research and Engagement Systems (CARES). "Calhoun County SC Report". University of Missouri Center for Applied Research and Engagement Systems (CARES). U.S. News & World Report. Retrieved November 27, 2019.
- ^ "Columbia's First Residents: The Congaree Indians". Fun After Fifty. Fun After Fifty. Retrieved December 1, 2019.
- ^ "Fort Motte Battle Site". Retrieved December 1, 2019.
- ^ "Illegal Calhoun County Tire Pile Seen From Space". Post and Courier.
- ^ "2020 County Gazetteer Files – South Carolina". United States Census Bureau. August 23, 2022. Retrieved September 10, 2023.
- ^ County, Calhoun. "Congaree Bluffs Heritage Preserve". Retrieved November 29, 2019.
-
^
"Congaree National Park". Congaree National Park. NPS.GOV. Retrieved November 29, 2019.
 This article incorporates text from this source, which is in the
public domain.
This article incorporates text from this source, which is in the
public domain.
- ^ "SCDNR Public Lands". www2.dnr.sc.gov. Retrieved April 1, 2023.
- ^ Holdman, Jessica. "How Dorian evacuation SC highway lane reversals will work". Post and Courier. Retrieved December 3, 2019.
- ^ "U.S. Decennial Census". United States Census Bureau. Retrieved March 16, 2015.
- ^ "Historical Census Browser". University of Virginia Library. Retrieved March 16, 2015.
- ^ Forstall, Richard L., ed. (March 27, 1995). "Population of Counties by Decennial Census: 1900 to 1990". United States Census Bureau. Retrieved March 16, 2015.
- ^ "Census 2000 PHC-T-4. Ranking Tables for Counties: 1990 and 2000" (PDF). United States Census Bureau. April 2, 2001. Archived (PDF) from the original on October 9, 2022. Retrieved March 16, 2015.
- ^ a b "State & County QuickFacts". United States Census Bureau. Archived from the original on June 28, 2011. Retrieved November 22, 2013.
- ^ "Explore Census Data". data.census.gov. Retrieved December 7, 2021.
- ^ USA, Data. "Calhoun County SC statistics". Datause.io. Retrieved November 29, 2019.
- ^ a b c "DP-1 Profile of General Population and Housing Characteristics: 2010 Demographic Profile Data". United States Census Bureau. Archived from the original on February 13, 2020. Retrieved March 9, 2016.
- ^ "Population, Housing Units, Area, and Density: 2010 - County". United States Census Bureau. Archived from the original on February 13, 2020. Retrieved March 9, 2016.
- ^ "DP02 SELECTED SOCIAL CHARACTERISTICS IN THE UNITED STATES – 2006-2010 American Community Survey 5-Year Estimates". United States Census Bureau. Archived from the original on February 13, 2020. Retrieved March 9, 2016.
- ^ "DP03 SELECTED ECONOMIC CHARACTERISTICS – 2006-2010 American Community Survey 5-Year Estimates". United States Census Bureau. Archived from the original on February 13, 2020. Retrieved March 9, 2016.
- ^ "U.S. Census website". United States Census Bureau. Retrieved May 14, 2011.
- ^ a b Officials: Calhoun County, SC website Archived May 13, 2018, at the Wayback Machine, 2016; accessed 29 December 2016
- ^ Leip, David. "Dave Leip's Atlas of U.S. Presidential Elections". uselectionatlas.org. Retrieved March 13, 2018.
- ^ Good, Steve. "Devro.com". Devro.com. Devro.com. Retrieved November 27, 2019.
- ^ "Country Clear". Country Clear. Retrieved November 28, 2019.
- ^ "SC Power Team". SC Power Team. Retrieved November 29, 2019.
External links
 Geographic data related to
Calhoun County, South Carolina at
OpenStreetMap
Geographic data related to
Calhoun County, South Carolina at
OpenStreetMap- Official website
- Calhoun County history and images
Places adjacent to Calhoun County, South Carolina | ||||||||||||||||
|---|---|---|---|---|---|---|---|---|---|---|---|---|---|---|---|---|
| ||||||||||||||||
Municipalities and communities of
Calhoun County, South Carolina, United States | ||
|---|---|---|
| Towns | 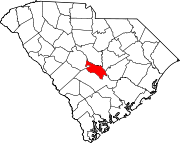 | |
|
Unincorporated communities | ||
| International | |
|---|---|
| National | |
| Other | |