Calape | |
|---|---|
| Municipality of Calape | |
 Center of Calape | |
.png) Flag  Seal | |
| Anthem: "Calape Hymn" | |
 Map of Bohol with Calape highlighted | |
.svg) Calape Location within the
Philippines | |
| Coordinates: 9°53′N 123°53′E / 9.88°N 123.88°E | |
| Country | Philippines |
| Region | Central Visayas |
| Province | Bohol |
| District | 1st district |
| Founded | 1802 |
| Barangays | 33 (see Barangays) |
| Government | |
| • Type | Sangguniang Bayan |
| • Mayor | Julius Caesar Falar Herrera |
| • Vice Mayor | Sulpicio Nesia Yu Jr. |
| • Representative | Edgardo Migriño Chatto |
| • Municipal Council | Members |
| • Electorate | 22,819 voters ( 2022) |
| Area | |
| • Total | 75.36 km2 (29.10 sq mi) |
| Elevation | 59 m (194 ft) |
| Highest elevation | 439 m (1,440 ft) |
| Lowest elevation | −1 m (−3 ft) |
| Population (2020 census)
[3] | |
| • Total | 33,079 |
| • Density | 440/km2 (1,100/sq mi) |
| • Households | 7,938 |
| Economy | |
| • Income class | 3rd municipal income class |
| • Poverty incidence | 17.40 |
| • Revenue | ₱ 138.6 million (2020) |
| • Assets | ₱ 424.1 million (2020) |
| • Expenditure | ₱ 120.5 million (2020) |
| • Liabilities | ₱ 60.72 million (2020) |
| Service provider | |
| • Electricity | Bohol 1 Electric Cooperative (BOHECO 1) |
| Time zone | UTC+8 ( PST) |
| ZIP code | 6328 |
| PSGC | |
| IDD : area code | +63 (0)38 |
| Native languages | Boholano dialect Cebuano Tagalog |
| Patron saint | Vincent Ferrer |
| Website | [1] |
Calape, officially the Municipality of Calape ( Cebuano: Munisipyo sa Calape; Tagalog: Bayan ng Calape), is a 3rd class municipality in the province of Bohol, Philippines. According to the 2020 census, it has a population of 33,079 people. [3]
Its name is derived from cape, referring to either a species of rattan or to the local varietal of coffee, Kape Barako, both of which still grow abundantly there to this day. [5]
History
By the time Spaniards arrived, there was already a native settlement in Calape. In 1802, the Spanish governor of Cebu established it as an independent municipality.
In 1957, the barangay of Abucayan Norte was created from the sitios of Cabulihan and Cabinong, and the barangay of Abucayan Sur from the sitios of Rama and Bino. The sitios of Binogawan, Masonoy, Bentig, Cahayag, and Lawis were also constituted into barrios.
Geography
Calape is bounded by Loon in the west and Tubigon in the east. To the north, the town center faces the Cebu Strait on the western side of Bohol Island, 42 kilometres (26 mi) from Tagbilaran. The jurisdiction of Calape includes the islands of Pangangan (eight barangays) and Mantatao, as well as two uninhabited islets, Poom Island and Basihan Island.
There are four rivers that flow through the territory: Tultugan and Liboron Rivers that drain into Calape Bay, and Calunasan and Abucayan Norte Rivers that drain into Tipcan Bay.
Most of the coastal area is a fairly level plain that gradually rises into rolling hills of coralline limestone. The highest point in Calape is Mount Candungao in the eastern portion of the town, with an elevation of 150 metres (500 ft) above sea level. [6]
Barangays

Calape is politically subdivided into 33 barangays. Each barangay consists of puroks and some have sitios.
There are 18 barangays which form part of coastal area.
| PSGC | Barangay | Population | ±% p.a. | |||
|---|---|---|---|---|---|---|
| 2020 [3] | 2010 [7] | |||||
| 071210001 | Abucayan Norte | 4.2% | 1,402 | 1,326 | 0.56% | |
| 071210002 | Abucayan Sur | 2.8% | 912 | 786 | 1.50% | |
| 071210003 | Banlasan | 2.2% | 736 | 755 | −0.25% | |
| 071210004 | Bentig | 5.9% | 1,949 | 1,797 | 0.82% | |
| 071210005 | Binogawan | 1.3% | 428 | 466 | −0.85% | |
| 071210006 | Bonbon | 3.9% | 1,296 | 1,222 | 0.59% | |
| 071210007 | Cabayugan | 2.8% | 920 | 880 | 0.45% | |
| 071210008 | Cabudburan | 1.5% | 507 | 548 | −0.77% | |
| 071210009 | Calunasan | 2.2% | 718 | 798 | −1.05% | |
| 071210010 | Camias | 1.4% | 468 | 505 | −0.76% | |
| 071210011 | Canguha | 0.9% | 300 | 283 | 0.58% | |
| 071210012 | Catmonan | 4.1% | 1,354 | 1,221 | 1.04% | |
| 071210013 | Desamparados ( Poblacion) | 2.4% | 786 | 880 | −1.12% | |
| 071210014 | Kahayag | 1.6% | 530 | 512 | 0.35% | |
| 071210015 | Kinabag‑an | 1.9% | 639 | 511 | 2.26% | |
| 071210016 | Labuon | 1.6% | 542 | 562 | −0.36% | |
| 071210017 | Lawis | 1.9% | 635 | 617 | 0.29% | |
| 071210018 | Liboron | 4.4% | 1,453 | 1,434 | 0.13% | |
| 071210019 | Lo‑oc | 1.4% | 458 | 506 | −0.99% | |
| 071210020 | Lomboy | 1.5% | 488 | 490 | −0.04% | |
| 071210021 | Lucob | 4.3% | 1,431 | 1,330 | 0.73% | |
| 071210022 | Madangog | 2.2% | 724 | 622 | 1.53% | |
| 071210023 | Magtongtong | 1.9% | 639 | 404 | 4.69% | |
| 071210024 | Mandaug | 4.1% | 1,358 | 1,451 | −0.66% | |
| 071210025 | Mantatao | 2.6% | 849 | 967 | −1.29% | |
| 071210027 | Sampoangon | 1.2% | 407 | 373 | 0.88% | |
| 071210028 | San Isidro | 6.6% | 2,195 | 2,412 | −0.94% | |
| 071210029 | Santa Cruz ( Poblacion) | 7.8% | 2,590 | 2,401 | 0.76% | |
| 071210030 | Sojoton | 1.5% | 491 | 664 | −2.97% | |
| 071210031 | Talisay | 1.4% | 470 | 415 | 1.25% | |
| 071210032 | Tinibgan | 2.1% | 685 | 733 | −0.67% | |
| 071210033 | Tultugan | 2.7% | 900 | 830 | 0.81% | |
| 071210034 | Ulbujan | 4.8% | 1,603 | 1,445 | 1.04% | |
| Total | 33,079 | 30,146 | 0.93% | |||
Climate
| Climate data for Calape, Bohol | |||||||||||||
|---|---|---|---|---|---|---|---|---|---|---|---|---|---|
| Month | Jan | Feb | Mar | Apr | May | Jun | Jul | Aug | Sep | Oct | Nov | Dec | Year |
| Mean daily maximum °C (°F) | 28 (82) |
28 (82) |
29 (84) |
31 (88) |
31 (88) |
30 (86) |
30 (86) |
30 (86) |
30 (86) |
29 (84) |
29 (84) |
28 (82) |
29 (85) |
| Mean daily minimum °C (°F) | 23 (73) |
23 (73) |
23 (73) |
23 (73) |
24 (75) |
24 (75) |
24 (75) |
24 (75) |
24 (75) |
24 (75) |
24 (75) |
23 (73) |
24 (74) |
| Average precipitation mm (inches) | 98 (3.9) |
82 (3.2) |
96 (3.8) |
71 (2.8) |
104 (4.1) |
129 (5.1) |
101 (4.0) |
94 (3.7) |
99 (3.9) |
135 (5.3) |
174 (6.9) |
143 (5.6) |
1,326 (52.3) |
| Average rainy days | 18.0 | 14.1 | 17.1 | 16.8 | 23.7 | 25.7 | 25.8 | 23.3 | 24.2 | 25.9 | 24.0 | 20.6 | 259.2 |
| Source: Meteoblue (Use with caution: this is modeled/calculated data, not measured locally.) [8] | |||||||||||||
Demographics
| Year | Pop. | ±% p.a. |
|---|---|---|
| 1903 | 13,354 | — |
| 1918 | 18,392 | +2.16% |
| 1939 | 21,319 | +0.71% |
| 1948 | 21,383 | +0.03% |
| 1960 | 22,820 | +0.54% |
| 1970 | 20,888 | −0.88% |
| 1975 | 21,499 | +0.58% |
| 1980 | 22,488 | +0.90% |
| 1990 | 24,608 | +0.91% |
| 1995 | 26,051 | +1.07% |
| 2000 | 27,921 | +1.50% |
| 2007 | 29,786 | +0.90% |
| 2010 | 30,146 | +0.44% |
| 2015 | 30,863 | +0.45% |
| 2020 | 33,079 | +1.37% |
| Source: Philippine Statistics Authority [9] [7] [10] [11] | ||
Religion
92% of Calape's population is Roman Catholic. The remaining 8% is divided among other religious groups.
Economy
Graphs are unavailable due to technical issues. There is more info on
Phabricator and on
MediaWiki.org. |
Gallery
-
 Calape Public Market
 -

-
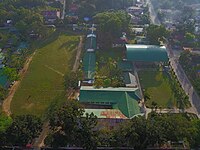 Calape Central Elementary School


Notable personalities
- Yoyoy Villame, a novelty singer
References
- ^ Municipality of Calape | (DILG)
- ^ "2015 Census of Population, Report No. 3 – Population, Land Area, and Population Density" (PDF). Philippine Statistics Authority. Quezon City, Philippines. August 2016. ISSN 0117-1453. Archived (PDF) from the original on May 25, 2021. Retrieved July 16, 2021.
- ^ a b c Census of Population (2020). "Region VII (Central Visayas)". Total Population by Province, City, Municipality and Barangay. Philippine Statistics Authority. Retrieved 8 July 2021.
- ^ "PSA Releases the 2018 Municipal and City Level Poverty Estimates". Philippine Statistics Authority. 15 December 2021. Retrieved 22 January 2022.
- ^ "Calape". www.bohol-philippines.com. Retrieved 2019-04-29.
- ^ "Topography". Municipality of Calape. Retrieved 3 October 2012.[ permanent dead link]
- ^ a b Census of Population and Housing (2010). "Region VII (Central Visayas)" (PDF). Total Population by Province, City, Municipality and Barangay. National Statistics Office. Retrieved 29 June 2016.
- ^ "Calape: Average Temperatures and Rainfall". Meteoblue. Retrieved 9 May 2020.
- ^ Census of Population (2015). "Region VII (Central Visayas)". Total Population by Province, City, Municipality and Barangay. Philippine Statistics Authority. Retrieved 20 June 2016.
-
^ Censuses of Population (1903–2007).
"Region VII (Central Visayas)".
Table 1. Population Enumerated in Various Censuses by Province/Highly Urbanized City: 1903 to 2007.
National Statistics Office.
{{
cite encyclopedia}}
: CS1 maint: numeric names: authors list ( link) - ^ "Province of Bohol". Municipality Population Data. Local Water Utilities Administration Research Division. Retrieved 17 December 2016.
- ^ "Poverty incidence (PI):". Philippine Statistics Authority. Retrieved December 28, 2020.
- ^ "Estimation of Local Poverty in the Philippines" (PDF). Philippine Statistics Authority. 29 November 2005.
- ^ "2003 City and Municipal Level Poverty Estimates" (PDF). Philippine Statistics Authority. 23 March 2009.
- ^ "City and Municipal Level Poverty Estimates; 2006 and 2009" (PDF). Philippine Statistics Authority. 3 August 2012.
- ^ "2012 Municipal and City Level Poverty Estimates" (PDF). Philippine Statistics Authority. 31 May 2016.
- ^ "Municipal and City Level Small Area Poverty Estimates; 2009, 2012 and 2015". Philippine Statistics Authority. 10 July 2019.
- ^ "PSA Releases the 2018 Municipal and City Level Poverty Estimates". Philippine Statistics Authority. 15 December 2021. Retrieved 22 January 2022.
External links
Places adjacent to Calape | ||||||||||||||||
|---|---|---|---|---|---|---|---|---|---|---|---|---|---|---|---|---|
| ||||||||||||||||