| 2004–05 South Pacific cyclone season | |
|---|---|
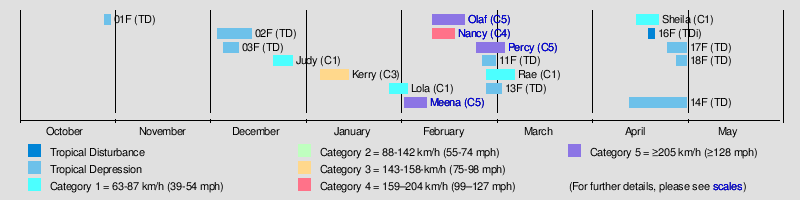
 Season summary map | |
| Seasonal boundaries | |
| First system formed | October 28, 2004 |
| Last system dissipated | May 1, 2005 |
| Strongest storm | |
| Name | Percy |
| • Maximum winds | 230 km/h (145 mph) (10-minute sustained) |
| • Lowest pressure | 900 hPa ( mbar) |
| Seasonal statistics | |
| Total disturbances | 18 |
| Total depressions | 17 |
| Tropical cyclones | 9 |
| Severe tropical cyclones | 5 |
| Total fatalities | None |
| Total damage | $55 million (2005 USD) |
| Related articles | |
The 2004–05 South Pacific cyclone season was an above-average season in which tropical cyclones formed within the South Pacific Ocean to the east of 160°E. The season officially ran from November 1, 2004 to April 30, 2005, however a tropical cyclone could form at any time between July 1, 2004 and June 30, 2005 and would count towards the season total. The season got off to an early start, when Tropical Depression 01F developed near the Solomon Islands on October 28, three days before the official start of the season. The final disturbance of the season dissipated as the season was drawing to a close on May 1. The season was above-average in terms of activity, with 9 tropical cyclones and 5 severe tropical cyclones forming during the season. The season featured Cyclone Percy, the most intense of the season in terms of pressure.
During the season, tropical cyclones are officially monitored by the Fiji Meteorological Service (FMS), Australian Bureau of Meteorology (BOM) and New Zealand's MetService. The United States Armed Forces through the Joint Typhoon Warning Center (JTWC) also monitors the basin and issue unofficial warnings for American interests. The FMS attaches a number and an F suffix to tropical disturbances that form in or move into the basin while the JTWC designates significant tropical cyclones with a number and a P suffix. The FMS, BoM and MetService all use the Australian Tropical Cyclone Intensity Scale and estimate wind speeds over a period of ten minutes, while the JTWC estimated sustained winds over a 1-minute period, which are subsequently compared to the Saffir–Simpson hurricane wind scale (SSHWS).
Seasonal summary
The first tropical depression of the season developed on October 28 to the northeast of Guadalcanal in the Solomon Islands. Over the next few days the system moved westwards and moved into the Australian region during October 30. There were no significant tropical disturbances observed during November, before Tropical Depression 02F developed to the north of Vanuatu during December 3. The system subsequently meandered over the ocean between Vanuatu and Fiji, before it was last noted to the southeast of Vanuatu during December 14. While Tropical Depression 02F was active, the third tropical depression of the season, developed to the south of Tuvalu on December 5. The system subsequently moved south-eastwards, before it was last noted during December 10 to the east of Nuku'alofa, Tonga. The fourth tropical disturbance of the season developed during December 21 and subsequently moved south-westwards, before it was named Judy during December 24, as it developed into the first tropical cyclone of the season.
Systems
Tropical Cyclone Judy
| Category 1 tropical cyclone (Australian scale) | |

 | |
| Duration | December 21 – December 27 |
|---|---|
| Peak intensity | 85 km/h (50 mph) (10-min); 989 hPa ( mbar) |
On December 21, RSMC Nadi reported that Tropical Disturbance 04F had developed, along an active and slow-moving monsoon trough near French Polynesia. [1] The depression was in an area of high shear, with the deep convection located to the northeast of the center. The low level circulation center at this time was exposed but was developing despite the high shear associated with the system. Early on December 24 deep convection associated with the system moved over the low level circulation center whilst the system was getting better organized. Later that day at 1800 UTC the Depression was upgraded to a category one tropical cyclone and was named Judy whilst located about 510 km (320 mi) southeast of Tahiti and moving towards the southwest. During the next few hours under strengthening shear, Judy struggled to maintain itself. However, as it moved further to the south it came under a strengthening steering field which was being enhanced by a trough of low pressure to the west of the steering field which helped to neutralize the effect of the shear over the cyclone. Judy then intensified slightly further and reached its peak intensity of 85 km/h (50 mph), with a peak pressure of 989 hPa late on December 25 whilst turning towards the south towards TCWC Wellington's area of responsibility. Judy degenerated into an extratropical cyclone during December 27, before it was last noted later that day as it merged with an area of low pressure to the south of Tahiti. [1] [2]
Severe Tropical Cyclone Kerry
| Category 3 severe tropical cyclone (Australian scale) | |
| Category 2 tropical cyclone (SSHWS) | |

 | |
| Duration | January 5 – January 14 |
|---|---|
| Peak intensity | 120 km/h (75 mph) (10-min); 970 hPa ( mbar) |
Tropical Cyclone Kerry developed from Tropical Depression 05F on January 5, 315 nautical miles (583 km) northeast of Port Vila, Vanuatu. Kerry moved to the southwest with 40-knot (70 km/h) winds as it moved over Vanuatu. Once past the island, Kerry moved on a west-southwest course and it began to intensify after turning to the west. The storm reached a peak intensity of 85 knots (157 km/h) before turning towards the south-southeast. The storm began to weaken under vertical shear and was downgraded to a depression on January 13. [3]
Tropical Cyclone Lola
| Category 1 tropical cyclone (Australian scale) | |

 | |
| Duration | January 26 – February 2 |
|---|---|
| Peak intensity | 75 km/h (45 mph) (10-min); 990 hPa ( mbar) |
Tropical Storm Lola developed from Tropical Depression 06F on January 31, 100 nautical miles (200 km) west-southwest of Tongatapu. Lola reached a peak intensity of 40 knots (70 km/h), but was downgraded to a depression on February 2. [4]
Severe Tropical Cyclone Meena
| Category 5 severe tropical cyclone (Australian scale) | |
| Category 4 tropical cyclone (SSHWS) | |

 | |
| Duration | February 1 – February 8 |
|---|---|
| Peak intensity | 215 km/h (130 mph) (10-min); 915 hPa ( mbar) |
On February 1, the RSMC Nadi began monitoring a tropical disturbance, which they designated as 07F, to the west of the Northern Cook Islands. [1] The next day, a small area of deep convection developed. [5]
Severe Tropical Cyclone Olaf
| Category 5 severe tropical cyclone (Australian scale) | |
| Category 5 tropical cyclone (SSHWS) | |
.jpg)
 | |
| Duration | February 10 – February 20 |
|---|---|
| Peak intensity | 215 km/h (130 mph) (10-min); 915 hPa ( mbar) |
The most intense system of the season, Tropical Cyclone Olaf developed rapidly like Nancy. By February 16, Olaf had attained maximum sustained winds of 145 knots (269 km/h) and was thrashing American Samoa. However bad the damage was, it could have been worse as Olaf veered east, its eyewall missing the islands.
Severe Tropical Cyclone Nancy
| Category 4 severe tropical cyclone (Australian scale) | |
| Category 4 tropical cyclone (SSHWS) | |

 | |
| Duration | February 10 – February 17 |
|---|---|
| Peak intensity | 175 km/h (110 mph) (10-min); 935 hPa ( mbar) |
Cyclone Nancy formed on February 10 as Tropical Disturbance 09F, over the next couple of days. The disturbance gradually developed and was designated as Cyclone Nancy during February 12 due to its outflow improving and a small area of deep convection, developing over the center of circulation, whilst it was located about 485 km (301 mi) east-northeast of Pago Pago, American Samoa. During that day Nancy started to rapidly intensify becoming a Severe Tropical Cyclone late on February 13 as a small, irregularly shaped, eye had begun to develop.
The next day both RSMC Nadi, and the JTWC reported that Cyclone Nancy had attained its peak intensity of 175 km/h (110 mph 10-minute winds) and 230 km/h (145 mph 1-minute winds). Increasing wind shear then caused Nancy to weaken. Early on February 15, the storm passed directly over Manuae. Continued weakening took place as a trough of low pressure approached from the southwest. By February 16, Nancy weakened below hurricane intensity and turned to the southwest as it began to undergo a Fujiwhara interaction with Cyclone Olaf, strong shear associated with the outflow of Cyclone Olaf caused all convection associated with Nancy to be displaced to the southwest on February 16. Early on February 17, Nancy transitioned into an extratropical cyclone as it entered the area of responsibility of TCWC Wellington. Shortly afterwards, the low was absorbed into the larger circulation of Olaf however it was monitored by TCWC Wellington as a separate system until 1200 UTC on February 18.
Already impacted by Cyclone Meena a week earlier, the Cook Islands sustained significant damage from Cyclone Nancy. Several homes were damaged and destroyed throughout the islands. Downed trees and power lines blocked roads and cut power and minor flooding was reported along coastal areas.
Severe Tropical Cyclone Percy
| Category 5 severe tropical cyclone (Australian scale) | |
| Category 5 tropical cyclone (SSHWS) | |

 | |
| Duration | February 24 – March 5 |
|---|---|
| Peak intensity | 230 km/h (145 mph) (10-min); 900 hPa ( mbar) |
Percy quickly formed from an area of low pressure on February 24 and reached Category 1 status north of American Samoa. The cyclone then moved eastward, peaking at Category 5 status before turning southward. Percy then passed through the southwestern Cook Islands causing severe damage before dissipating. [6]
Tropical Cyclone Rae
| Category 1 tropical cyclone (Australian scale) | |
| Tropical storm (SSHWS) | |

 | |
| Duration | February 28 – March 6 |
|---|---|
| Peak intensity | 75 km/h (45 mph) (10-min); 990 hPa ( mbar) |
Tropical Depression 13F
| Tropical depression (Australian scale) | |
 | |
| Duration | March 2 – March 4 |
|---|---|
| Peak intensity | Winds not specified; 1001 hPa ( mbar) |
Late on February 27, RSMC Nadi reported that a suspect tropical disturbance was developing near to the north of Rennel Island, in the Solomon Islands. [7] Over the next couple of days the system gradually developed and before it was declared as a tropical disturbance early on March 1. At this time convection detached from the disturbance's low level circulation center, whilst vertical wind shear around the system remained weak. [7] [8] [9] Early the next day, the Disturbance was then relocated to the northwest of Viti Levu in Fiji, before it was designated as Tropical Depression 13F later that day. [10] [11] The Depression remained weak reaching an estimated central pressure of 1001 hPa (mbar) early on March 3, however there were no winds reported by RSMC Nadi whilst they were monitoring it. [11] [12] RSMC Nadi then issued their last advisory on 13F early on March 4 after no persistent convection reported around the system since the depression reached its peak pressure. [11] [13]
Tropical Depression 14F
| Tropical depression (Australian scale) | |
| | |
| Duration | April 14 – May 1 |
|---|---|
| Peak intensity | 55 km/h (35 mph) (10-min); 1000 hPa ( mbar) |
Tropical Cyclone Sheila
| Category 1 tropical cyclone (Australian scale) | |

 | |
| Duration | April 20 – April 23 |
|---|---|
| Peak intensity | 75 km/h (45 mph) (10-min); 990 hPa ( mbar) |
Other systems
Tropical Depression 01F developed on October 28, within the monsoon trough about 420 km (260 mi) to the northeast of Guadalcanal. [14] [15] Over the next couple of days the system moved westwards and moved into the Australian region, during October 30, where it was monitored for a few days by TCWC Brisbane. [14] The second tropical depression of the season developed on December 3, about 280 km (170 mi) to the north of Port Villa, Vanuatu. [2] Over the next week the poorly organised system meandered over the ocean between Vanuatu and Fiji, before it started to organise during December 12, with RSMC Nadi issuing gale warnings on the system. [2] The system subsequently moved southwards between Vanuatu and Fiji, before it was last noted during December 14, while it was located to the southeast of Port Villa. [2] While Tropical Depression 02F was active, the third tropical depression of the season, developed to the south of Tuvalu on December 5. [2] The system subsequently moved south-eastwards, before it was last noted during December 10 to the east of Nuku'alofa, Tonga. [2]
During February 26, RSMC Nadi reported that Tropical Depression 11F had formed, within the Tuamotu Archipelago of islands in French Polynesia. [16] During the next day the system moved eastwards before it was last noted during the next day as it degenerated into a tropical disturbance. [7] [17]
During April 20 Tropical Disturbance 16F developed within a monsoon trough, about 570 km (350 mi) to the southeast of Apia on the Samoan island: Upolu. [18] During April 21, the disturbance moved towards the southwest and affected Niue while starting to rapidly weaken, before it was last noted during April 22 wrapping into Cyclone Sheila's circulation. [19] [20] [21] Tropical Depression 17F then developed on April 26 while located about 710 km (440 mi) to the northeast of Pago-Pago in American Samoa.
During April 29, Tropical Depression 18F developed within a monsoon trough about 635 km (395 mi), to the northeast of Suva, Fiji. [22] Over the next 24 hours the system moved towards the southeast while deep convection surrounding the system failed to become organized and started to weaken. [23] The depression was last noted during the next day, as it dissipated about 445 km (277 mi), to the northeast of Suva. [20] [24]
Season effects
This table lists all the storms that developed in the South Pacific to the east of longitude 160°E during the 2004–05 season. It includes their intensity on the Australian Tropical cyclone intensity scale, duration, name, landfalls, deaths, and damages. All data is taken from RSMC Nadi and/or TCWC Wellington, and all of the damage figures are in 2005 USD.
| Name | Dates | Peak intensity | Areas affected | Damage ( USD) |
Deaths | Refs | ||
|---|---|---|---|---|---|---|---|---|
| Category | Wind speed | Pressure | ||||||
| 01F | October 28–30 | Tropical depression | 45 km/h (30 mph) | 1,001 hPa (29.56 inHg) | [25] | |||
| 02F | December 3–14 | Tropical depression | 55 km/h (35 mph) | 1,000 hPa (29.53 inHg) | [26] | |||
| 03F | December 3–14 | Tropical depression | 45 km/h (30 mph) | 1,000 hPa (29.53 inHg) | [26] | |||
| Judy | December 21–27 | Category 1 tropical cyclone | 85 km/h (50 mph) | 987 hPa (29.15 inHg) | [27] | |||
| Kerry | January 5–14 | Category 3 severe tropical cyclone | 140 km/h (85 mph) | 970 hPa (28.64 inHg) | [27] | |||
| Lola | January 27 – February 2 | Category 1 tropical cyclone | 75 km/h (45 mph) | 990 hPa (29.23 inHg) | [27] | |||
| Meena | February 1–8 | Category 5 severe tropical cyclone | 215 km/h (130 mph) | 915 hPa (27.02 inHg) | Cook Islands | $20 million | None | [27] |
| Olaf | February 10–20 | Category 5 severe tropical cyclone | 215 km/h (130 mph) | 915 hPa (27.02 inHg) | Samoan Islands, Cook Islands | $10 million | None | [27] |
| Nancy | February 10–17 | Category 4 severe tropical cyclone | 175 km/h (110 mph) | 935 hPa (27.61 inHg) | Samoan Islands, Cook Islands | None | [27] | |
| Percy | February 24 – March 5 | Category 5 severe tropical cyclone | 230 km/h (145 mph) | 900 hPa (26.58 inHg) | Tokelau, Samoan Islands, Cook Islands | $25 million | None | [27] |
| 11F | February 26–27 | Tropical depression | 55 km/h (35 mph) | 998 hPa (29.47 inHg) | French Polynesia | None | None | |
| Rae | February 27–6 | Category 1 Tropical cyclone | 75 km/h (45 mph) | 990 hPa (29.23 inHg) | No areas affected | None | None | [27] |
| 13F | February 27 – March 4 | Tropical depression | Not specified | 1,001 hPa (29.56 inHg) | [28] | |||
| 14F | April 14 – May 1 | Tropical depression | 55 km/h (35 mph) | 1,000 hPa (29.53 inHg) | [24] | |||
| Sheila | April 20–22 | Category 1 tropical cyclone | 75 km/h (45 mph) | 990 hPa (29.23 inHg) | [27] | |||
| 16F | April 20–22 | Tropical disturbance | Not specified | 1,000 hPa (29.53 inHg) | Niue | |||
| 17F | April 26 – May 1 | Tropical depression | Not specified | 1,007 hPa (29.74 inHg) | [24] | |||
| 18F | April 29 – May 1 | Tropical depression | Not specified | 1,006 hPa (29.71 inHg) | [24] | |||
| Season aggregates | ||||||||
| 18 systems | October 28 – May 1 | 230 km/h (145 mph) | 900 hPa (26.58 inHg) | >$55 million | ||||
See also
- Tropical cyclones in 2004 and 2005
- List of Southern Hemisphere tropical cyclone seasons
- Atlantic hurricane seasons: 2004, 2005
- Pacific hurricane seasons: 2004, 2005
- Pacific typhoon seasons: 2004, 2005
- North Indian Ocean cyclone seasons: 2004, 2005
References
- ^ a b c RSMC Nadi — Tropical Cyclone Centre. Tropical Cyclone Summary 2004 — 2005 Season (PDF) (Report). Fiji Meteorological Service. Archived from the original (PDF) on 2009-02-25. Retrieved 2012-04-16.
- ^ a b c d e f Padgett, Gary (2005). "Gary Padgett's Monthly Global Tropical Cyclone Summary December 2004". Australian Severe Weather. Archived from the original on July 5, 2008. Retrieved March 8, 2015.
- ^ "Summary of South Pacific and South Indian Ocean Tropical Cyclones". 2005 Annual Tropical Cyclone Report. Joint Typhoon Warning Center. Archived from the original on 2011-06-07. Retrieved 2007-12-02.
- ^ Gary Padgett (2005-01-19). "Global Tropical Cyclone Tracks — January 2005". Typhoon2000.ph. Archived from the original on 19 December 2007. Retrieved 2007-12-02.
- ^ Gary Padgett (April 25, 2005). "Monthly Tropical Cyclone Summary for February 2005". Typhoon 2000. Retrieved February 12, 2009.
- ^ Monthly Global Tropical Cyclone Summary February 2005
- ^ a b c "Tropical cyclone Advisories issued on February 27, 2005". Fiji Meteorological Service. MT Archive. 2005-02-27. Retrieved 2009-07-09.
- ^ "Tropical cyclone Advisories issued on February 28, 2005". Fiji Meteorological Service. MT Archive. 2005-02-28. Retrieved 2009-07-09. [ dead link]
- ^ "Tropical cyclone Advisories issued on March 01, 2005". Fiji Meteorological Service. MT Archive. 2005-03-01. Retrieved 2009-07-09.
- ^ "Tropical cyclone Advisories issued on March 2, 2005". Fiji Meteorological Service. MT Archive. 2005-03-02. Retrieved 2009-07-09.
- ^ a b c "Tropical cyclone Advisories issued on March 3, 2005". Fiji Meteorological Service. MT Archive. 2005-03-03. Retrieved 2009-07-09.
- ^ "Gary Padgetts Monthly Global Tropical Cyclone Tracks March 2005". Australian Severe Weather. 2005. Retrieved 2009-07-09.
- ^ "Tropical cyclone Advisories issued on March 4, 2005". Fiji Meteorological Service. MT Archive. 2005-03-04. Retrieved 2009-07-09.
- ^ a b Padgett, Gary. "Monthly Global Tropical Cyclone Summary October 2004". Archived from the original on 2008-10-11. Retrieved 2012-04-15.
- ^ RSMC Nadi – Tropical Cyclone Centre (October 28, 2004). "Tropical Disturbance Summary October 28, 2004 21z". Fiji Meteorological Service. MT Archive. Archived from the original on January 20, 2016. Retrieved March 8, 2015.
- ^ "Tropical Cyclone Advisories issued on February 26, 2005". Fiji Meteorological Service. MT Archive. 2005-02-26. Retrieved 2010-01-14.
- ^ Padgett, Gary. "Monthly Global Tropical Cyclone Tracks February 2005". Archived from the original on 2011-09-28. Retrieved 2012-04-15.
- ^ RSMC Nadi — Tropical Cyclone Centre. "Tropical Disturbance Summary 2005-04-20 23z". Fiji Meteorological Service. Retrieved 2012-04-16.
- ^ RSMC Nadi — Tropical Cyclone Centre. "Tropical Disturbance Summary 2005-04-22 00z". Fiji Meteorological Service. Retrieved 2012-04-16.
- ^ a b Padgett, Gary. "Monthly Global Tropical Cyclone Summary April 2005". Archived from the original on 2012-02-11. Retrieved 2012-04-16.
- ^ RSMC Nadi — Tropical Cyclone Centre. "Tropical Disturbance Summary 2005-04-22 09z". Fiji Meteorological Service. Retrieved 2012-04-16.
- ^ RSMC Nadi — Tropical Cyclone Centre. "Tropical Disturbance Summary 2005-04-29 23z". Fiji Meteorological Service. Retrieved 2012-04-17.
- ^ RSMC Nadi — Tropical Cyclone Centre. "Tropical Disturbance Summary 2005-04-30 23z". Fiji Meteorological Service. Retrieved 2012-04-17.
- ^ a b c d Padgett, Gary. "Monthly Global Tropical Cyclone Tracks April 2005". Archived from the original on 2011-09-28. Retrieved 2012-04-15.
- ^ Padgett, Gary. "Monthly Global Tropical Cyclone Tracks October 2004". Archived from the original on 2011-09-28. Retrieved 2012-04-15.
- ^ a b Padgett, Gary. "Monthly Global Tropical Cyclone Tracks December 2004". Archived from the original on 2011-09-28. Retrieved 2012-04-15.
- ^ a b c d e f g h i RSMC Nadi — Tropical Cyclone Centre; Fiji Meteorological Service (2009-05-22). "RSMC Nadi Best Track Data for the 2004/2005 Tropical Cyclone Season". International Best Track Archive for Climate Stewardship. Retrieved 2012-04-18.
- ^ Padgett, Gary. "Monthly Global Tropical Cyclone Tracks March 2005". Archived from the original on 2011-09-28. Retrieved 2012-04-15.
External links
- World Meteorological Organization
- Australian Bureau of Meteorology
- Fiji Meteorological Service
- New Zealand MetService
- Joint Typhoon Warning Center
Tropical cyclones of the
2004–05 South Pacific cyclone season | ||
|---|---|---|
| ||