From Wikipedia, the free encyclopedia
Election in New Mexico
1924 United States presidential election in New Mexico
County Results
Coolidge
40-50%
50-60%
60-70%
70-80%
Davis
40-50%
50-60%
60-70%
70-80%
The 1924 United States presidential election in New Mexico took place on November 4, 1924. All contemporary forty-eight state were part of the
1924 United States presidential election . State voters chose three electors to represent them in the
Electoral College , which voted for
President and
Vice President .
New Mexico was won by incumbent
Republican President
Calvin Coolidge of Massachusetts with 48.5% of the vote, over
Democratic West Virginia Congressman
John W. Davis 's 43%, and
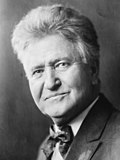
Progressive Party Wisconsin U.S. Senator
Robert La Follette 's 8.5%.
Results Results by county
County
John Calvin Coolidge
[1]
John William Davis
[1]
Robert M. La Follette, Sr.
Margin
%
#
%
#
%
#
%
#
Valencia
78.01%
3,183
16.62%
678
5.37%
219
61.40%
2,505
Socorro
62.32%
2,332
33.43%
1,251
4.25%
159
28.89%
1,081
Doña Ana
58.58%
2,823
36.83%
1,775
4.59%
221
21.75%
1,048
Santa Fe
59.05%
4,010
38.32%
2,602
2.64%
179
20.73%
1,408
Taos
58.68%
2,470
39.32%
1,655
2.00%
84
19.36%
815
Sandoval
58.52%
1,587
40.41%
1,096
1.07%
29
18.10%
491
McKinley
51.24%
1,653
35.65%
1,150
13.11%
423
15.59%
503
Rio Arriba
56.24%
3,707
41.48%
2,734
2.28%
150
14.76%
973
Torrance
51.18%
1,666
38.99%
1,269
9.83%
320
12.20%
397
Lincoln
49.05%
1,087
37.77%
837
13.18%
292
11.28%
250
Guadalupe
51.83%
1,329
41.19%
1,056
6.98%
179
10.65%
273
Catron
47.30%
499
39.62%
418
13.08%
138
7.68%
81
Bernalillo
49.55%
7,078
42.17%
6,023
8.28%
1,183
7.39%
1,055
Luna
43.28%
709
36.39%
596
20.33%
333
6.90%
113
Sierra
48.17%
632
41.62%
546
10.21%
134
6.55%
86
Colfax
48.06%
3,512
41.97%
3,067
9.96%
728
6.09%
445
San Miguel
50.56%
3,894
46.00%
3,543
3.44%
265
4.56%
351
San Juan
44.88%
889
41.34%
819
13.78%
273
3.53%
70
Mora
50.90%
2,197
48.35%
2,087
0.74%
32
2.55%
110
Harding
42.14%
721
41.73%
714
16.13%
276
0.41%
7
Otero
41.17%
832
43.84%
886
14.99%
303
-2.67%
-54
Grant
39.59%
1,756
47.00%
2,085
13.41%
595
-7.42%
-329
Union
37.77%
1,415
46.32%
1,735
15.91%
596
-8.54%
-320
Chaves
39.40%
1,519
56.24%
2,168
4.36%
168
-16.84%
-649
Quay
27.84%
851
50.64%
1,548
21.52%
658
-22.80%
-697
Hidalgo
28.19%
261
51.40%
476
20.41%
189
-23.22%
-215
De Baca
29.03%
270
61.72%
574
9.25%
86
-32.69%
-304
Curry
20.55%
669
53.39%
1,738
26.05%
848
27.34%
[a]
890
Eddy
28.36%
658
65.69%
1,524
5.95%
138
-37.33%
-866
Roosevelt
19.54%
398
65.78%
1,340
14.68%
299
-46.24%
-942
Lea
18.75%
138
75.00%
552
6.25%
46
-56.25%
-414
Notes
^ In this county where La Follette ran ahead of Coolidge, percentage margin given is Davis percentage minus La Follette percentage. Vote margin is Davis vote total minus La Follette vote total.
References
^
a b Scammon, Richard M. (compiler); America at the Polls: A Handbook of Presidential Election Statistics 1920-1964 ; p. 304
ISBN
0405077114


