Wheeler County | |
|---|---|
 Wheeler County Courthouse | |
 Location within the U.S. state of
Texas | |
 Texas's location within the
U.S. | |
| Coordinates: 35°24′N 100°16′W / 35.4°N 100.27°W | |
| Country | |
| State | |
| Founded | 1879 |
| Named for | Royall T. Wheeler |
| Seat | Wheeler |
| Largest city | Shamrock |
| Area | |
| • Total | 915 sq mi (2,370 km2) |
| • Land | 915 sq mi (2,370 km2) |
| • Water | 1.0 sq mi (3 km2) 0.1% |
| Population (
2020) | |
| • Total | 4,990 |
| • Density | 5.5/sq mi (2.1/km2) |
| Time zone | UTC−6 ( Central) |
| • Summer ( DST) | UTC−5 ( CDT) |
| Congressional district | 13th |
| Website |
www |


Wheeler County is a county located in the U.S. state of Texas. As of the 2020 census, its population was 4,990. [1] Its county seat is Wheeler. [2] The county was formed in 1876 and organized in 1879. [3] It is named for Royall Tyler Wheeler, a chief justice of the Texas Supreme Court.
Wheeler County was formerly one of 30 entirely dry counties in the state of Texas. [4] However, circa 2010, the community of Shamrock, located in Wheeler County at the intersection of Interstate 40 and U.S. Highway 83, voted to allow liquor sales. Within the city limits of Shamrock is the only place to purchase liquor in Wheeler County.
The Pioneer West Museum, the Wheeler County historical museum, is located in Shamrock off U.S. Highway 83.
Geography
According to the U.S. Census Bureau, the county has a total area of 915 square miles (2,370 km2), of which 915 square miles (2,370 km2) are land and 1.0 square mile (2.6 km2) (0.1%) is covered by water. [5]
Major highways
U.S. Highway 66 is no longer officially commissioned or signed, but has special brown historic signage at various points along its former routing.
Adjacent counties
- Hemphill County (north)
- Roger Mills County, Oklahoma (northeast)
- Beckham County, Oklahoma (east)
- Collingsworth County (south)
- Gray County (west)
- Donley County (southwest)
- Roberts County (northwest)
Demographics
| Census | Pop. | Note | %± |
|---|---|---|---|
| 1880 | 512 | — | |
| 1890 | 778 | 52.0% | |
| 1900 | 636 | −18.3% | |
| 1910 | 5,258 | 726.7% | |
| 1920 | 7,397 | 40.7% | |
| 1930 | 15,555 | 110.3% | |
| 1940 | 12,411 | −20.2% | |
| 1950 | 10,317 | −16.9% | |
| 1960 | 7,947 | −23.0% | |
| 1970 | 6,434 | −19.0% | |
| 1980 | 7,137 | 10.9% | |
| 1990 | 5,879 | −17.6% | |
| 2000 | 5,284 | −10.1% | |
| 2010 | 5,410 | 2.4% | |
| 2020 | 4,990 | −7.8% | |
| U.S. Decennial Census
[6] 1850–2010 [7] 2010 [8] 2020 [9] | |||
| Race / Ethnicity | Pop 2010 [8] | Pop 2020 [9] | % 2010 | % 2020 |
|---|---|---|---|---|
| White alone (NH) | 3,847 | 3,469 | 71.11% | 69.52% |
| Black or African American alone (NH) | 112 | 81 | 2.07% | 1.62% |
| Native American or Alaska Native alone (NH) | 20 | 33 | 0.37% | 0.66% |
| Asian alone (NH) | 23 | 24 | 0.43% | 0.48% |
| Pacific Islander alone (NH) | 0 | 2 | 0.00% | 0.04% |
| Some Other Race alone (NH) | 3 | 12 | 0.06% | 0.24% |
| Mixed Race/Multi-Racial (NH) | 61 | 142 | 1.13% | 2.85% |
| Hispanic or Latino (any race) | 1,344 | 1,227 | 24.84% | 24.59% |
| Total | 5,410 | 4,990 | 100.00% | 100.00% |
Note: the US Census treats Hispanic/Latino as an ethnic category. This table excludes Latinos from the racial categories and assigns them to a separate category. Hispanics/Latinos can be of any race.
As of the census [10] of 2000, there were 5,284 people, 2,152 households, and 1,487 families residing in the county. The population density was 6 people per square mile (2.3 people/km2). There were 2,687 housing units at an average density of 3 units per square mile (1.2 units/km2). The racial makeup of the county was 87.83% White, 2.78% Black or African American, 0.78% Native American, 0.55% Asian, 0.08% Pacific Islander, 6.64% from other races, and 1.34% from two or more races. 12.57% of the population were Hispanic or Latino of any race.
There were 2,152 households, out of which 29.60% had children under the age of 18 living with them, 58.00% were married couples living together, 7.70% had a female householder with no husband present, and 30.90% were non-families. 29.10% of all households were made up of individuals, and 16.90% had someone living alone who was 65 years of age or older. The average household size was 2.39 and the average family size was 2.94.
In the county, the population was spread out, with 24.90% under the age of 18, 6.50% from 18 to 24, 22.50% from 25 to 44, 25.20% from 45 to 64, and 20.90% who were 65 years of age or older. The median age was 42 years. For every 100 females there were 92.00 males. For every 100 females age 18 and over, there were 87.40 males.
The median income for a household in the county was $31,029, and the median income for a family was $36,989. Males had a median income of $26,790 versus $19,091 for females. The per capita income for the county was $16,083. About 11.60% of families and 13.00% of the population were below the poverty line, including 13.30% of those under age 18 and 16.80% of those age 65 or over.
Politics
Republican Drew Springer, Jr., a businessman from Muenster in Cooke County, has since January 2013 represented Wheeler County in the Texas House of Representatives. [11]
The representative from 1971 to 1979 was the Democrat Phil Cates, later a lobbyist in Austin. [12]
| Year | Republican | Democratic | Third party | |||
|---|---|---|---|---|---|---|
| No. | % | No. | % | No. | % | |
| 2020 | 2,159 | 92.38% | 168 | 7.19% | 10 | 0.43% |
| 2016 | 2,087 | 90.50% | 194 | 8.41% | 25 | 1.08% |
| 2012 | 1,878 | 88.25% | 232 | 10.90% | 18 | 0.85% |
| 2008 | 1,918 | 85.43% | 314 | 13.99% | 13 | 0.58% |
| 2004 | 1,960 | 81.87% | 420 | 17.54% | 14 | 0.58% |
| 2000 | 1,787 | 74.80% | 579 | 24.24% | 23 | 0.96% |
| 1996 | 1,355 | 59.20% | 750 | 32.77% | 184 | 8.04% |
| 1992 | 1,458 | 52.69% | 938 | 33.90% | 371 | 13.41% |
| 1988 | 1,703 | 61.33% | 1,067 | 38.42% | 7 | 0.25% |
| 1984 | 2,251 | 73.51% | 805 | 26.29% | 6 | 0.20% |
| 1980 | 1,626 | 59.28% | 1,090 | 39.74% | 27 | 0.98% |
| 1976 | 1,273 | 44.08% | 1,598 | 55.33% | 17 | 0.59% |
| 1972 | 1,766 | 77.87% | 502 | 22.13% | 0 | 0.00% |
| 1968 | 1,176 | 45.97% | 812 | 31.74% | 570 | 22.28% |
| 1964 | 1,138 | 44.11% | 1,440 | 55.81% | 2 | 0.08% |
| 1960 | 1,428 | 58.43% | 1,011 | 41.37% | 5 | 0.20% |
| 1956 | 1,178 | 48.22% | 1,252 | 51.25% | 13 | 0.53% |
| 1952 | 1,645 | 51.37% | 1,551 | 48.44% | 6 | 0.19% |
| 1948 | 370 | 15.04% | 2,010 | 81.71% | 80 | 3.25% |
| 1944 | 511 | 19.54% | 1,869 | 71.47% | 235 | 8.99% |
| 1940 | 517 | 16.55% | 2,600 | 83.23% | 7 | 0.22% |
| 1936 | 277 | 10.24% | 2,415 | 89.31% | 12 | 0.44% |
| 1932 | 165 | 6.75% | 2,263 | 92.56% | 17 | 0.70% |
| 1928 | 1,038 | 57.86% | 750 | 41.81% | 6 | 0.33% |
| 1924 | 197 | 17.12% | 908 | 78.89% | 46 | 4.00% |
| 1920 | 198 | 26.33% | 516 | 68.62% | 38 | 5.05% |
| 1916 | 56 | 8.00% | 554 | 79.14% | 90 | 12.86% |
| 1912 | 35 | 6.31% | 402 | 72.43% | 118 | 21.26% |
Communities
Cities
Census-designated places
Other unincorporated communities
See also
- List of museums in the Texas Panhandle
- National Register of Historic Places listings in Wheeler County, Texas
- Recorded Texas Historic Landmarks in Wheeler County
References
- ^ "Wheeler County, Texas". United States Census Bureau. Retrieved January 30, 2022.
- ^ "Find a County". National Association of Counties. Retrieved June 7, 2011.
- ^ "Texas: Individual County Chronologies". Texas Atlas of Historical County Boundaries. The Newberry Library. 2008. Retrieved May 27, 2015.
- ^ "Local Option Elections | TABC".
- ^ "2010 Census Gazetteer Files". United States Census Bureau. August 22, 2012. Retrieved May 12, 2015.
- ^ "Decennial Census of Population and Housing by Decades". US Census Bureau.
- ^ "Texas Almanac: Population History of Counties from 1850–2010" (PDF). Texas Almanac. Archived (PDF) from the original on October 9, 2022. Retrieved May 12, 2015.
- ^ a b "P2 HISPANIC OR LATINO, AND NOT HISPANIC OR LATINO BY RACE - 2010: DEC Redistricting Data (PL 94-171) - Wheeler County, Texas". United States Census Bureau.
- ^ a b "P2 HISPANIC OR LATINO, AND NOT HISPANIC OR LATINO BY RACE - 2020: DEC Redistricting Data (PL 94-171) - Wheeler County, Texas". United States Census Bureau.
- ^ "U.S. Census website". United States Census Bureau. Retrieved May 14, 2011.
- ^ "State Rep. Springer announces district tour July 30". Lubbock Avalanche-Journal, July 16, 2013. Retrieved July 18, 2013.
- ^ "Phil Cates". Texas Legislative Reference Library. Retrieved June 29, 2015.
- ^ Leip, David. "Dave Leip's Atlas of U.S. Presidential Elections". uselectionatlas.org. Retrieved August 1, 2018.
External links
![]() Media related to
Wheeler County, Texas at Wikimedia Commons
Media related to
Wheeler County, Texas at Wikimedia Commons
- Wheeler County Official Website
- Wheeler County from the Handbook of Texas Online
- Wheeler County Profile from the Texas Association of Counties
- Entry for Royal T. Wheeler from the Biographical Encyclopedia of Texas published 1880, hosted by the Portal to Texas History.
- Historic Wheeler County materials, hosted by the Portal to Texas History.
Places adjacent to Wheeler County, Texas | ||||||||||||||||
|---|---|---|---|---|---|---|---|---|---|---|---|---|---|---|---|---|
| ||||||||||||||||
Municipalities and communities of
Wheeler County, Texas, United States | ||
|---|---|---|
| Cities | 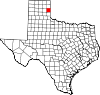 | |
| CDP | ||
|
Other communities | ||
| International | |
|---|---|
| National | |
| Other | |