
-

-

-

-

-
-

-
-
-

-
 11. Austin, Texas
 -

-
-
 14. Columbus, Ohio
 -

-

-

-

-
 19. Denver, Colorado
 -

-

-

-
 23. El Paso, Texas
 -

-
 25. Portland, Oregon
 -

-

-
-
-
-

-

-
 33. Tucson, Arizona
 -

-

-
-
 37. Mesa, Arizona
 -
 38. Atlanta, Georgia
 -
 39. Omaha, Nebraska
 -
-

-
-

-
 44. Miami, Florida
 -

-

-
 47. Tulsa, Oklahoma
 -

-
 49. Wichita, Kansas
 -
 50. Arlington, Texas
| Population tables of U.S. cities |
|---|
 |
| Cities |
| Urban areas |
| Populous cities and metropolitan areas |
| Metropolitan areas |
| Megaregions |
|
This is a list of the most populous incorporated places of the United States. As defined by the United States Census Bureau, an " incorporated place" includes a variety of designations, including city, town, village, borough, and municipality. [a] A few exceptional census-designated places (CDPs) are also included in the Census Bureau's listing of incorporated places. [b] Consolidated city-counties represent a distinct type of government that includes the entire population of a county, or county equivalent. Some consolidated city-counties, however, include multiple incorporated places. This list presents only that portion (or "balance") of such consolidated city-counties that are not a part of another incorporated place.
This list refers only to the population of individual municipalities within their defined limits; the populations of other municipalities considered suburbs of a central city are listed separately, and unincorporated areas within urban agglomerations are not included. Therefore, a different ranking is evident when considering U.S. metropolitan area populations.
50 states and District of Columbia
This table lists the 326 incorporated places in the United States (excluding the U.S. territories) with a population of at least 100,000 on April 1, 2020, as enumerated by the United States Census Bureau. Five states— Delaware, Maine, Vermont, West Virginia and Wyoming—have no cities with populations of 100,000 or more. The table displays:
- The city rank by population as of April 1, 2020, as enumerated by the United States Census Bureau [1]
- The city name [1]
- The name of the state in which the city lies [1]
- The city population as of April 1, 2020, as enumerated by the 2020 United States Census [1]
- The city population as of April 1, 2010, as enumerated by the 2010 United States Census [1]
- The city percent population change from April 1, 2010, to April 1, 2020
- The city land area as of January 1, 2020 [2]
- The city population density as of April 1, 2020 (residents per unit of land area) [2]
- The city latitude and longitude coordinates [2]
Map this section's coordinates using
OpenStreetMap
Download coordinates as:

The 10 most populous
cities of the United States (2020 census)
| State capital | |
| State largest city | |
| State capital and largest city | |
| Federal capital |
| 2020 rank |
City | State [c] | 2020 census |
2010 census |
Change | 2020 land area | 2020 population density | Location | ||
|---|---|---|---|---|---|---|---|---|---|---|
| % | ||||||||||
| 1 |
|
|
8,175,133 | 783.83 (64,60%) | 10,429.67 | 8,008,278 | 2.1% | |||
| 2 |
|
|
3,792,621 | 1,213.85 (93,23%) | 3,124.46 | 3,694,820 | 2.6% | |||
| 3 |
|
|
2,695,598 | 589.56 (97,23%) | 4,572.23 | 2,896,016 | -6.9% | |||
| 4 |
|
|
2,099,451 | 1,552.93 (95,55%) | 1,351.93 | 1,953,631 | 7.5% | |||
| 5 |
|
|
1,526,006 | 347.32 (93,97%) | 4,393.69 | 1,517,550 | 0.6% | |||
| 6 | Phoenix |
|
1,445,632 | 1,338.25 (99,76%) | 1,080.24 | 1,321,045 | 9.4% | |||
| 7 |
|
|
1,327,407 | 1,193.80 (98,76%) | 1,111.91 | 1,144,646 | 16.0% | |||
| 8 |
|
|
1,307,402 | 842.24 (87,32%) | 1,552.29 | 1,223,400 | 6.9% | |||
| 9 |
|
|
1,197,816 | 881.94 (88,25%) | 1,358.16 | 1,188,580 | 0.8% | |||
| 10 |
|
|
945,942 | 457.21 (98,09%) | 2,068.94 | 894,943 | 5.7% | |||
| 11 |
|
|
821,784 | 1,934.72 (85,41%) | 424.76 | 735,617 | 11.7% | |||
| 12 |
|
|
820,445 | 936.10 (98,21%) | 876.45 | 781,870 | 4.9% | |||
| 13 |
|
|
805,235 | 121.39 (20,21%) | 6,633.30 | 776,733 | 3.7% | |||
| 14 |
|
|
790,390 | 771.56 (97,65%) | 1,024.41 | 656,562 | 20.4% | |||
| 15 |
|
|
787,033 | 562.47 (97,34%) | 1,399.25 | 711,470 | 10.6% | |||
| 16 | Fort Worth |
|
741,206 | 880.13 (97,69%) | 842.16 | 534,694 | 38.6% | |||
| 17 |
|
|
731,424 | 770.99 (99,34%) | 948.68 | 540,828 | 35.2% | |||
| 18 |
|
|
713,777 | 359.36 (97,12%) | 1,986.24 | 951,270 | -25.0% | |||
| 19 |
|
|
649,121 | 661.07 (99,60%) | 981.93 | 563,662 | 15.2% | |||
| 20 |
|
|
646,889 | 815.98 (97,24%) | 792.78 | 650,100 | -0.5% | |||
| 21 |
|
|
620,961 | 209.63 (87,93%) | 2,962.12 | 651,154 | -4.6% | |||
| 22 |
|
|
617,594 | 125.04 (53,86%) | 4,938.99 | 589,141 | 4.8% | |||
| 23 | Seattle |
|
608,660 | 217.40 (58,84%) | 2,799.68 | 563,374 | 8.0% | |||
| 24 |
|
|
601,723 | 158.12 (89,33%) | 3,805.48 | 572,059 | 5.2% | |||
| 25 |
|
|
601,222 | 1,230.58 (95,63%) | 488.57 | |||||
| 26 | Denver |
|
600,158 | 396.27 (98,95%) | 1,514.52 | 554,636 | 8.2% | |||
| 27 | Louisville [4] |
|
597,337 | 842.39 (95,04%) | 709.09 | |||||
| 28 | Milwaukee |
|
594,833 | 248.95 (99,30%) | 2,389.37 | 596,974 | -0.4% | |||
| 29 | Portland |
|
583,776 | 345.58 (91,96%) | 1,689.25 | 529,121 | 10.3% | |||
| 30 | Las Vegas |
|
583,756 | 351.75 (99,96%) | 1,659.59 | 478,434 | 22.0% | |||
| 31 | Oklahoma City |
|
579,999 | 1,570.59 (97,68%) | 369.29 | 506,132 | 14.6% | |||
| 32 | Albuquerque |
|
545,852 | 486.22 (99,04%) | 1,122.65 | 448,607 | 21.7% | |||
| 33 | Tucson |
|
545,852 | 486.22 (99,04%) | 1,122.65 | 486,699 | 6.9% | |||
| 34 | Fresno |
|
520,116 | 587.18 (99,86%) | 885.79 | 427,652 | 15.7% | |||
| 35 | Sacramento |
|
466,488 | 253.61 (97,81%) | 1,839.38 | 407,018 | 14.6% | |||
| 36 | Long Beach |
|
462,257 | 130.25 (97,76%) | 3,548.98 | 461,522 | 0.2% | |||
| 37 | Kansas City |
|
459,787 | 815.72 (98,72%) | 563.66 | 441,545 | 4.1% | |||
| 38 | Mesa |
|
439,041 | 353.40 (99,55%) | 1,242.32 | 396,375 | 10.8% | |||
| 39 | Virginia Beach [5] |
|
437,994 | 644.96 (50,07%) | 679.10 | 425,257 | 3.0% | |||
| 40 | Atlanta |
|
420,003 | 344.86 (99,36%) | 1,217.91 | 416,474 | 0.8% | |||
| 41 | Colorado Springs |
|
416,427 | 503.86 (99,81%) | 826.48 | 360,890 | 15.4% | |||
| 42 | Omaha |
|
408,958 | 329.16 (97,33%) | 1,242.42 | 390,007 | 4.9% | |||
| 43 | Raleigh |
|
403,892 | 370.11 (99,24%) | 1,091.28 | 276,093 | 46.3% | |||
| 44 | Miami |
|
399,457 | 92.90 (63,99%) | 4,299.73 | 362,470 | 10.2% | |||
| 45 | Cleveland |
|
396,815 | 201.24 (94,22%) | 1,971.83 | 478,403 | -17.1% | |||
| 46 | Tulsa |
|
391,906 | 509.58 (97,89%) | 769.08 | 393,049 | -0.3% | |||
| 47 | Oakland |
|
390,724 | 144.50 (71,53%) | 2,704.06 | 399,484 | -2.2% | |||
| 48 | Minneapolis |
|
382,578 | 139.78 (93,91%) | 2,736.97 | 382,618 | 0.0% | |||
| 49 | Wichita |
|
382,368 | 412.56 (97,37%) | 926.82 | 344,284 | 11.1% | |||
| 50 | Arlington |
|
365,438 | 248.33 (96,25%) | 1,471.59 | 332,969 | 9.8% | |||
| 51 | Bakersfield |
|
347,483 | 368.19 (98,99%) | 943.75 | 247,057 | 40.6% | |||
| 52 | New Orleans |
|
343,829 | 438.80 (48,38%) | 783.57 | 484,674 | -29.1% | |||
| 53 | Honolulu [6] |
|
337,256 | 156.75 (88,44%) | 2,151.61 | 371,657 | -9.3% | |||
| 54 | Anaheim |
|
336,265 | 129.09 (98,09%) | 2,604.99 | 328,014 | 2.5% | |||
| 55 | Tampa |
|
335,709 | 293.73 (64,72%) | 1,142.91 | 303,447 | 10.6% | |||
| 56 | Aurora |
|
325,078 | 400.75 (99,55%) | 811.18 | 276,393 | 17.6% | |||
| 57 | Santa Ana |
|
324,528 | 70.63 (99,09%) | 4,594.83 | 337,977 | -4.0% | |||
| 58 | St. Louis [7] |
|
319,294 | 160.35 (93,76%) | 1,991.28 | 348,189 | -8.3% | |||
| 59 | Pittsburgh |
|
305,704 | 143.41 (94,91%) | 2,131.71 | 334,563 | -8.6% | |||
| 60 | Corpus Christi |
|
305,215 | 415.98 (32,81%) | 733.73 | 277,454 | 10.0% | |||
| 61 | Riverside |
|
303,871 | 210.15 (99,63%) | 1,445.96 | 255,166 | 19.1% | |||
| 62 | Cincinnati |
|
296,943 | 201.86 (97,98%) | 1,471.01 | 331,285 | -10.4% | |||
| 63 | Lexington |
|
295,803 | 734.65 (99,33%) | 402.64 | 260,512 | 13.5% | |||
| 64 | Anchorage |
|
291,826 | 4,415.10 (86,93%) | 66.10 | 260,283 | 12.1% | |||
| 65 | Stockton |
|
291,707 | 159.72 (95,24%) | 1,826.31 | 243,771 | 19.7% | |||
| 66 | Toledo |
|
287,208 | 208.99 (95,92%) | 1,374.29 | 313,619 | -8.4% | |||
| 67 | Saint Paul |
|
285,068 | 134.63 (92,52%) | 2,117.46 | 287,151 | -0.7% | |||
| 68 | Newark |
|
277,140 | 62.65 (92,65%) | 4,423.50 | 273,546 | 1.3% | |||
| 69 | Greensboro |
|
269,666 | 327.69 (95,99%) | 822.94 | 223,891 | 20.4% | |||
| 70 | Buffalo |
|
261,310 | 104.58 (76,93%) | 2,498.57 | 292,648 | -10.7% | |||
| 71 | Plano |
|
259,841 | 185.39 (99,50%) | 1,401.58 | 222,030 | 17.0% | |||
| 72 | Lincoln |
|
258,379 | 230.79 (98,62%) | 1,119.52 | 225,581 | 14.5% | |||
| 73 | Henderson |
|
257,729 | 279.02 (100%) | 923.70 | 175,381 | 47.0% | |||
| 74 | Fort Wayne |
|
253,691 | 286.50 (99,81%) | 885.47 | 205,727 | 23.3% | |||
| 75 | Jersey City |
|
247,597 | 38.31 (70,16%) | 6,463.67 | 240,055 | 3.1% | |||
| 76 | São Petersburgo |
|
244,769 | 159.91 (44,87%) | 1,530.71 | 248,232 | -1.4% | |||
| 77 | Chula Vista |
|
243,916 | 128.54 (95,28%) | 1,897.57 | 173,556 | 40.5% | |||
| 78 | Norfolk |
|
242,803 | 140.17 (56,17%) | 1,732.20 | 234,403 | 3.6% | |||
| 79 | Orlando |
|
238,300 | 265.21 (92,52%) | 898.52 | 185,951 | 28.2% | |||
| 80 | Chandler |
|
236,123 | 166.82 (99,83%) | 1,415.43 | 176,581 | 33.7% | |||
| 81 | Laredo |
|
236,091 | 230.28 (98,40%) | 1,025.25 | 176,576 | 33.7% | |||
| 82 | Madison |
|
233,209 | 198.89 (81,67%) | 1,172.58 | 208,054 | 12.1% | |||
| 83 | Winston-Salem |
|
229,573 | 343.04 (99,07%) | 669.35 | 185,776 | 23.6% | |||
| 84 | Lubbock |
|
229,617 | 317.04 (99,08%) | 724.11 | 199,564 | 15.0% | |||
| 85 | Baton Rouge |
|
229,493 | 199.30 (97,28%) | 1,151.50 | 227,818 | 0.7% | |||
| 86 | Durham |
|
228,330 | 278.09 (99,16%) | 821.07 | 187,035 | 22.1% | |||
| 87 | Garland |
|
226,876 | 147.84 (99,76%) | 1,534.64 | 215,768 | 5.1% | |||
| 88 | Glendale |
|
226,721 | 155.35 (99,75%) | 1,459.44 | 218,812 | 3.6% | |||
| 89 | Reno |
|
225,221 | 266.79 (97,29%) | 844.17 | 180,480 | 24.8% | |||
| 90 | Hialeah |
|
224,669 | 55.56 (93,91%) | 4,044.06 | 226,419 | -0.8% | |||
| 91 | Chesapeake |
|
222,209 | 882.67 (97,13%) | 251.75 | 199,184 | 11.6% | |||
| 92 | Scottsdale |
|
217,385 | 476.35 (99,74%) | 456.36 | 202,705 | 7.2% | |||
| 93 | North Las Vegas |
|
216,961 | 262.50 (99,96%) | 826.53 | 115,488 | 87.9% | |||
| 94 | Irving |
|
216,290 | 173.58 (98,53%) | 1,246.05 | 191,615 | 12.9% | |||
| 95 | Fremont |
|
214,089 | 200.62 (88,41%) | 1,067.13 | 203,413 | 5.2% | |||
| 96 | Irvine |
|
212,375 | 171.22 (99,49%) | 1,240.33 | 143,072 | 48.4% | |||
| 97 | Birmingham |
|
212,237 | 378.32 (98,29%) | 561.00 | 242,820 | -12.6% | |||
| 98 | Rochester |
|
210,565 | 92.67 (96,31%) | 2,272.21 | 219,773 | -4.2% | |||
| 99 | San Bernardino |
|
209,924 | 153.33 (99,25%) | 1,369.12 | 185,401 | 13.2% | |||
| 100 | Spokane |
|
208,916 | 153.46 (98,72%) | 1,361.40 | 195,629 | 6.8% | |||
| 101 | Gilbert |
|
208,453 | 176.02 (99,72%) | 1,184.29 | 109,697 | 90.0% | |||
| 102 | Arlington [8] |
|
207,627 | 67.26 (99,62%) | 3,086.84 | 189,453 | 9.6% | |||
| 103 | Montgomery |
|
205,764 | 413.28 (98,55%) | 497.88 | 201,568 | 2.1% | |||
| 104 | Boise |
|
205,671 | 205.54 (99,14%) | 1,000.63 | 185,787 | 10.7% | |||
| 105 | Richmond [5] |
|
204,214 | 154.91 (95,76%) | 1,318.30 | 197,790 | 3.2% | |||
| 106 | Des Moines |
|
203,433 | 209.45 (97,91%) | 971.26 | 198,682 | 2.4% | |||
| 107 | Modesto |
|
201,165 | 95.49 (99,41%) | 2,106.60 | 188,856 | 6.5% | |||
| 108 | Fayetteville |
|
200,564 | 377.72 (98,73%) | 530.98 | 121,015 | 65.7% | |||
Distribution
The total 2020 enumerated population of all cities over 100,000 is 96,598,047, representing 29.14% of the United States population (excluding territories) and covering a total land area of 29,588 square miles (76,630 km2). The mean city population is 301,765, and the mean density is 4,151 inhabitants per square mile (1,603/km2).
| Population | Number of municipal governments |
|---|---|
| 1,000,000+ | 10 |
| 300,000–999,999 | 59 |
| 200,000–299,999 | 52 |
| 100,000–199,999 | 205 |
| Total | 326 |
| State | Number of listed cities |
|---|---|
| CA | 75 |
| TX | 40 |
| FL | 22 |
| CO | 12 |
| AZ, NC, WA | 10 |
| MA | 9 |
| GA, IL, MI, VA | 8 |
| NJ | 7 |
| MO, OH, TN | 6 |
| CT, KS, NV, NY, OR | 5 |
| AL, IN, LA, OK, UT | 4 |
| ID, IA, MN, NM, PA, SC, WI | 3 |
| KY, NE | 2 |
| AK, AR, DC, HI, MD, MS, MT, ND, NH, RI, SD | 1 |
| DE, ME, VT, WV, WY | 0 |
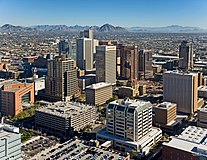
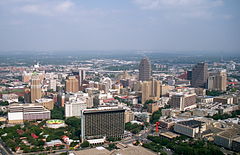
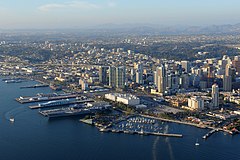
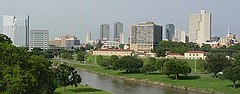
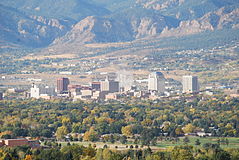
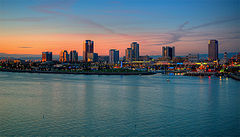
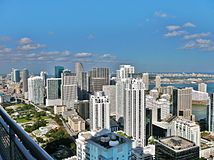
Gallery


.jpg)


.jpg)


.jpg)


.jpg)


Puerto Rico

The following table lists the five municipalities (municipios) of Puerto Rico with a population greater than 100,000 on July 1, 2020, as estimated by the United States Census Bureau.
The table below contains the following information:
- The municipio rank by population as of April 1, 2020, as enumerated by the United States Census Bureau
- The municipio [9]
- The municipio population as of April 1, 2020, as estimated by the United States Census Bureau [9]
- The municipio population as of April 1, 2010, as enumerated by the 2010 United States Census [9]
- The municipio percent population change from April 1, 2010, to April 1, 2020
- The municipio land area as of January 1, 2016 [2]
- The municipio population density as of April 1, 2020 (residents per land area) [2]
- The municipio latitude and longitude coordinates
| 2020 Rank | Municipio | 2020 Census | 2010 Census | Change | 2016 land area | 2020 population density | Location | ||
|---|---|---|---|---|---|---|---|---|---|
| 1 | San Juan | 342,259 | 395,326 | −13.42% | 39.5 sq mi | 102.3 km2 | 8,665/sq mi | 3,346/km2 | 18°24′N 66°04′W / 18.40°N 66.06°W |
| 2 | Bayamón | 185,187 | 208,116 | −11.02% | 27.0 sq mi | 69.9 km2 | 6,859/sq mi | 2,648/km2 | 18°23′N 66°10′W / 18.38°N 66.16°W |
| 3 | Carolina | 154,815 | 176,762 | −12.42% | 20.7 sq mi | 53.6 km2 | 7,479/sq mi | 2,888/km2 | 18°25′N 65°58′W / 18.41°N 65.97°W |
| 4 | Ponce | 137,491 | 166,327 | −17.34% | 30.7 sq mi | 79.5 km2 | 4,479/sq mi | 1,729/km2 | 17°59′N 66°36′W / 17.98°N 66.60°W |
| 5 | Caguas | 127,244 | 142,893 | −10.95% | 10.9 sq mi | 28.2 km2 | 11,700/sq mi | 4,500/km2 | 18°14′N 66°02′W / 18.23°N 66.03°W |
Other U.S. territories
As of 2021, four U.S. territories ( American Samoa, Guam, the Northern Mariana Islands, and the U.S. Virgin Islands) do not have any cities with at least 100,000 people; because of this, no cities for these territories are listed. [10]
| Territory | Number of listed cities |
|---|---|
| AS, GU, MP, VI | 0 |
Census-designated places
The following table lists U.S. census-designated places (CDPs) with populations of at least 100,000 according to the 2020 Census. A CDP is a concentration of population identified by the United States Census Bureau for statistical purposes. CDPs are delineated for each decennial census as the statistical counterparts of incorporated places such as cities, towns and villages. CDPs are populated areas that lack separate municipal government, but which otherwise physically resemble incorporated places. Unlike the incorporated cities in the main list, the US Census Bureau does not release annual population estimates for CDPs.
The table below contains the following information:
- The census-designated place
- The state
- The census-designated place population as of April 1, 2020, as enumerated by the 2020 United States Census
- The census-designated place population as of April 1, 2010, as enumerated by the 2010 United States Census
- The census-designated place percent population change from April 1, 2010, to April 1, 2020
- The census-designated place land area as of January 1, 2020 [2]
- The census-designated place population density as of April 1, 2020 (residents per land area) [2]
- The census-designated place ANSI INCITS 446–2008 geographic code
- The census-designated place latitude and longitude coordinates
| Census-designated place | State | 2020 census | 2010 census | Change | 2020 land area | 2020 population density | ANSI | Location | ||
|---|---|---|---|---|---|---|---|---|---|---|
| Arlington | Virginia | 238,643 | 207,627 | +14.94% | 25.97 sq mi | 67.262 km2 | 9,189/sq mi | 3,548/km2 | 38°53′N 77°11′W / 38.88°N 77.18°W | |
| Enterprise | Nevada | 221,831 | 108,481 | +104.49% | 46.513 sq mi | 120.468 km2 | 4,769/sq mi | 1,841/km2 | 02408084 | 36°01′N 115°13′W / 36.01°N 115.21°W |
| Spring Valley | Nevada | 215,597 | 178,395 | +20.85% | 33.226 sq mi | 86.055 km2 | 6,489/sq mi | 2,505/km2 | 02408797 | 36°05′N 115°16′W / 36.09°N 115.26°W |
| Sunrise Manor | Nevada | 205,618 | 189,372 | +8.58% | 33.352 sq mi | 86.381 km2 | 6,165/sq mi | 2,380/km2 | 02410035 | 36°10′N 115°02′W / 36.17°N 115.04°W |
| Paradise | Nevada | 191,238 | 223,167 | −14.31% | 46.717 sq mi | 120.996 km2 | 4,094/sq mi | 1,581/km2 | 02409023 | 36°05′N 115°08′W / 36.08°N 115.13°W |
| Metairie | Louisiana | 143,507 | 138,481 | +3.63% | 23.222 sq mi | 60.145 km2 | 6,180/sq mi | 2,390/km2 | 02403282 | 29°59′N 90°10′W / 29.99°N 90.17°W |
| East Los Angeles | California | 118,786 | 126,496 | −6.10% | 7.448 sq mi | 19.290 km2 | 15,949/sq mi | 6,158/km2 | 02408711 | 34°02′N 118°10′W / 34.03°N 118.16°W |
| Brandon | Florida | 114,626 | 103,483 | +10.77% | 33.101 sq mi | 85.731 km2 | 3,463/sq mi | 1,337/km2 | 02402711 | 27°56′N 82°17′W / 27.93°N 82.29°W |
| The Woodlands | Texas | 114,436 | 93,847 | +21.94% | 43.29 sq mi | 112.121 km2 | 2,643/sq mi | 1,020/km2 | 30°11′N 95°30′W / 30.18°N 95.50°W | |
| Spring Hill | Florida | 113,568 | 98,621 | +15.16% | 59.81 sq mi | 154.907 km2 | 1,899/sq mi | 733/km2 | 28°29′N 82°33′W / 28.49°N 82.55°W | |
| Riverview | Florida | 107,396 | 71,050 | +51.16% | 46.19 sq mi | 119.632 km2 | 2,325/sq mi | 898/km2 | 27°52′N 82°19′W / 27.87°N 82.32°W | |
| Columbia | Maryland | 104,681 | 99,615 | +5.09% | 31.93 sq mi | 82.698 km2 | 3,278/sq mi | 1,266/km2 | 39°12′N 76°52′W / 39.20°N 76.86°W | |
| Highlands Ranch | Colorado | 103,444 | 96,713 | +6.96% | 24.26 sq mi | 62.833 km2 | 4,263/sq mi | 1,646/km2 | 39°32′N 104°58′W / 39.54°N 104.97°W | |
Cities formerly over 100,000 people
The following table lists U.S. cities that, in past censuses, have had populations of at least 100,000 but have since decreased beneath this threshold or have been consolidated with or annexed into a neighboring city.
The table below contains the following information:
- Name of city
- Name of state
- The city population as of April 1, 2020, as enumerated by the 2020 United States Census [1]
- The city's peak population based on highest official enumeration recorded by the Census (and the year of that particular Census)
- The percent decline in population from its peak Census count to the most recent Census enumeration in 2020.
- Additional notes.
| City | State | 2020 Census | Peak population | Percent decline from peak population |
Notes |
|---|---|---|---|---|---|
| Albany | New York | 99,224 | 134,995 | −26.50% | Peak in 1950, +1.40% since 2010. |
| Allegheny | Pennsylvania | NA | 129,896 | NA | Peak as an independent city, annexed by Pittsburgh in 1907. In the 2010 Census, the population of all neighborhoods of Pittsburgh that were formerly part of Allegheny City totalled 43,421. [d] |
| Brooklyn | New York | NA | 806,343 | NA | Peak as an independent city, consolidated with New York City in 1898. The estimated 2020 population for Brooklyn was 2,538,934. |
| Camden | New Jersey | 71,791 | 124,555 | −42.36% | Peak in 1950, −7.18% since 2010. |
| Canton | Ohio | 70,872 | 116,912 | −39.38% | Peak in 1950, −2.92% since 2010. |
| Citrus Heights | California | 87,583 | 107,439 | −18.48% | Peak in 1990, +5.14% since 2010. |
| Duluth | Minnesota | 86,697 | 107,312 | −19.21% | Peak in 1960, +0.50% since 2010. |
| Erie | Pennsylvania | 94,831 | 138,440 | −31.50% | Peak in 1960, −6.83% since 2010. |
| Fall River | Massachusetts | 94,000 | 120,485 | −21.98% | Peak in 1920, +5.79% since 2010. |
| Flint | Michigan | 81,252 | 196,940 | −58.74% | Peak in 1960, −20.68% since 2010. |
| Gary | Indiana | 69,093 | 178,320 | −61.25% | Peak in 1960, −13.95% since 2010. |
| Hammond | Indiana | 77,879 | 111,698 | −30.28% | Peak in 1960, −3.65% since 2010. |
| Livonia | Michigan | 95,535 | 110,109 | −13.24% | Peak in 1970, −1.45% since 2010. |
| Niagara Falls | New York | 48,671 | 102,394 | −52.47% | Peak in 1960, −3.03% since 2010. |
| Parma | Ohio | 81,146 | 100,216 | −19.03% | Peak in 1970, −0.56% since 2010. |
| Portsmouth | Virginia | 97,915 | 114,773 | −14.69% | Peak in 1960, +2.49% since 2010. |
| Reading | Pennsylvania | 95,112 | 111,171 | −14.45% | Peak in 1930, +7.98% since 2010. |
| Scranton | Pennsylvania | 76,328 | 143,333 | −46.75% | Peak in 1930, +0.31% since 2010. |
| Somerville | Massachusetts | 81,045 | 103,908 | −22.00% | Peak in 1930, +6.98% since 2010. |
| St. Joseph | Missouri | 72,473 | 102,979 | −29.62% | Official peak in 1900, but there is evidence the count was padded by about 25,000; [11] −5.61% since 2010. |
| Trenton | New Jersey | 90,871 | 128,009 | −29.01% | Peak in 1950, +7.02% since 2010. |
| Utica | New York | 65,283 | 101,740 | −35.83% | Peak in 1930, +4.90% since 2010. |
| Wilmington | Delaware | 70,898 | 112,504 | −36.98% | Peak in 1940, +0.07% since 2010. |
| Youngstown | Ohio | 60,068 | 170,002 | −64.67% | Peak in 1930, −10.32% since 2010. |
Locations of 50 most populous cities

Location of 50 largest cities by population in the United States
See also
- Demographics of the United States
- Largest cities in the United States by population by decade
- List of largest cities – (world)
- List of largest cities of U.S. states and territories by population
- List of United States cities by area
- List of United States cities by elevation
- List of United States cities by population density
- Lists of populated places in the United States
- United States Census Bureau
- Office of Management and Budget
Notes
- ^ Towns in New England, while incorporated on a level similar to cities in other states, are considered minor civil divisions by the Census Bureau and are not included in its list of incorporated places. A detailed discussion on this subject can be found at New England town#Census treatment of the New England town system.
- ^ The State of Hawaiʻi has no incorporated municipalities other than the City and County of Honolulu, which comprises the entire Island of Oʻahu. In accordance with Hawaiian law, the United States Census Bureau defines the state's "cities" and "towns" as Census Designated Places (CDPs). The Census Bureau defines the Urban Honolulu CDP as the portion of the City and County of Honolulu that is coextensive with the Judicial District of Honolulu. The Urban Honolulu CDP is what is generally thought of as the "city" of Honolulu, and its population is used here and in other population comparisons. The Urban Honolulu CDP is currently the most populous Census Designated Place in the United States. The Honolulu, HI Metropolitan Statistical Area comprises the entire City and County of Honolulu.
- ^ Or federal district in the case of Washington, D.C.
- ^ All North Side neighborhoods of Pittsburgh (41,120), plus an additional 2,301 in Census Tract 4270 Blocks 2 & 3, which are the sections of Millvale, Pennsylvania that were formally part of Allegheny City.
References
- ^ a b c d e f "Decennial Census P.L. 94-171 Redistricting Data". United States Census Bureau, Population Division. Retrieved August 12, 2021.
- ^ a b c d e f g "2020 U.S. Gazetteer Files". U.S. Gazetteer Files. United States Census Bureau. Retrieved September 9, 2021.
- ^ Jacksonville, na Flórida, é uma cidade-condado consolidada com o Condado de Duval. A população é dada para a cidade excluindo outros lugares incorporados dentro do Condado de Duval. De acordo com o censo de 2010, a população consolidada incluindo outras populações incorporadas é de 864,263.
- ^ a b c Indianapolis (Indiana); Louisville (Kentucky); Nashville (Tennessee); Augusta (Geórgia); e Athens (Geórgia) são cidades-condado consolidadas. A população é dado para toda a cidade, excluindo outros lugares incorporados situados dentro dos limites do condado. (Veja Indianapolis (balance); Louisville/Condado de Jefferson metro government (balance); e Nashville-Davidson (balance).
- ^ a b As cidades na Virgínia, com exceção de Arlington, são todas cidades independentes que não fazem parte de nenhum condado em particular.
- ^ O Havaí não possui qualquer outro município incorporado além da cidade e condado de Honolulu, que na verdade inclui toda a ilha de Oahu. De acordo com a legislação do Havaí, o US Census Bureau define as cidades (cities e towns) do estado como regiões censo-designadas (CDPs). O Census Bureau define a região censo-designada de Honolulu como parte da Cidade e Condado, a qual é co-existente com o Distrito Judicial de Honolulu. A região censo-designada de Honolulu é geralmente considerada como "cidade" de Honolulu, e sua população é utilizado aqui e em outras comparações de população. Se toda a população da cidade e condado fosse considerada, Honolulu estaria na 10ª posição da lista acima, com uma população estimada em 2010 de 953,207 habitantes.
- ^ Baltimore e St. Louis são cidades independentes que não fazem parte de nenhum condado em particular.
- ^ A região censo-designada de Arlington, Virgínia, é co-existente com o Condado de Arlington. A legislação da Virgínia proíbe a criação de cidades em condados com mais de mil pessoas por milha quadrada, o que o Condado de Arlington excede. Assim, todo o condado é considerado pelo Census Bureau como um CDP. Apesar de não ser incorporado, Arlington está incluído na lista anual do Census Bureau nos localidades incorporadas e é mantida na lista acima.
- ^ a b c "Puerto Rico Municipios Population Totals: 2010-2020". 2020 Census Population Estimates. U.S. Census Bureau, Population Division. May 2021. Retrieved May 30, 2021.
- ^ CIA World Factbook - American Samoa / Guam / Northern Mariana Islands / U.S. Virgin Islands. Retrieved July 6, 2021.
- ^ Bob Slater. "Civic Pride Ran Amok With 1900 Census". St. Joseph News-Press. Retrieved February 13, 2021.
External links
United States at Wikipedia's
sister projects
 Definitions from Wiktionary
 Media from Commons
 News from Wikinews
 Quotations from Wikiquote
 Texts from Wikisource
 Textbooks from Wikibooks
 Resources from Wikiversity
 Travel information from Wikivoyage
Template:Featured list is only for Wikipedia:Featured lists.