From Wikipedia, the free encyclopedia

The following is a list of ice hockey arenas by capacity. Only those arenas that regularly host ice hockey games with paid admission (e.g. professional, major junior, or university) are included. Outdoor stadiums that have hosted occasional hockey games are not included. Buildings under construction are not included. Buildings which no longer host hockey matches are listed but not ranked, and the capacity for defunct buildings is the capacity at the time of closing, or last use for hockey, unless otherwise mentioned. Buildings are ranked by their current maximum capacity for hockey games, not for other events—which is often substantially different because of ice hockey's unique playing surface, the ice rink. Capacities do not include standing room tickets. All arenas with a capacity of more than 15,000 or smaller are included.

The majority of these arenas are in Canada and the United States, with a small number in Europe; none are on any other continent. Most of the largest arenas are home to professional teams, mainly from the National Hockey League (NHL). All 32 current NHL arenas are listed. None of the teams in the top leagues in Finland ( Liiga) or Sweden ( SHL), and only one team each in the top league of Czech Republic ( Czech Extraliga), and Germany ( Deutsche Eishockey Liga), Switzerland ( National League A) or the international Kontinental Hockey League (KHL) (Belarus, China, Kazakhstan, and Russia), play in an arena with a capacity of 15,000 or larger. Arenas with an * are NHL arenas.

Arenas by capacity

Rank Arena Capacity
( Seating capacity only)
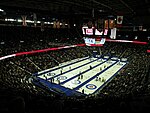
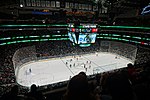
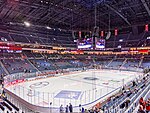
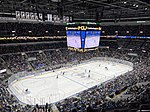
City Country Home team(s) (League, Dates) Image
1 SKA Arena 21,542 Saint Petersburg  Russia SKA St. Petersburg ( KHL) (2023-present)
2 Bell Centre* 21,105 [1] Montreal  Canada Montreal Canadiens ( NHL) (1996–present)
3 United Center* 19,717 [2][ verification needed] Chicago  United States Chicago Blackhawks ( NHL) (1995–present)
4 Wells Fargo Center* 19,537 [3] Philadelphia  United States Philadelphia Flyers ( NHL) (1996–present)
5 Little Caesars Arena* 19,515 [4] Detroit  United States Detroit Red Wings ( NHL) (2017–present)
6 Scotiabank Saddledome* 19,289 [5] Calgary  Canada Calgary Flames ( NHL) (1983–present), Calgary Hitmen ( WHL) (1995–present)
7 Amerant Bank Arena* 19,250 [6] Sunrise  United States Florida Panthers ( NHL) (1998–present)
8 Amalie Arena* 19,092 [7] Tampa  United States Tampa Bay Lightning ( NHL) (1996–present)
9 KeyBank Center* 19,070 [8] Buffalo  United States Buffalo Sabres ( NHL) (1996–present)
10 Rocket Mortgage FieldHouse 18,924 [9] Cleveland  United States Cleveland Monsters ( AHL) (2007–present)
11 Rogers Arena* 18,910 [10] Vancouver  Canada Vancouver Canucks ( NHL) (1995–present)
12 Scotiabank Arena* 18,800 [11] Toronto  Canada Toronto Maple Leafs ( NHL) (1999–present)
13 PNC Arena* 18,700 [12] Raleigh  United States Carolina Hurricanes ( NHL) (1999–present)
14 Canadian Tire Centre* 18,652 [13] Ottawa  Canada Ottawa Senators ( NHL) (1996–present)
15 Rogers Place* 18,641 Edmonton  Canada Edmonton Oilers ( NHL) (2016–present), Edmonton Oil Kings ( WHL) (2016–present)
16 Capital One Arena* 18,573 [14] Washington  United States Washington Capitals ( NHL) (1997–present)
17 American Airlines Center* 18,532 [15] Dallas  United States Dallas Stars ( NHL) (2001–present)
18 Lanxess Arena 18,500 [16] Cologne  Germany Kölner Haie ( DEL) (1998–present)
19 PPG Paints Arena* 18,387 [17] Pittsburgh  United States Pittsburgh Penguins ( NHL) (2010–present)
20 The Moda Center 18,280[ citation needed] Portland  United States Portland Winterhawks ( WHL) (1995–present)
21 Videotron Centre 18,259 [18] Quebec City  Canada Quebec Remparts ( QMJHL) (2015–present)
22 Crypto.com Arena* 18,230 [19] Los Angeles  United States Los Angeles Kings ( NHL) (1999–present)
23 Nationwide Arena* 18,144 [20] Columbus  United States Columbus Blue Jackets ( NHL) (2000–present)
24 Enterprise Center* 18,096 [21] St. Louis  United States St. Louis Blues ( NHL) (1994–present)
25 Xcel Energy Center* 18,064 [22] St. Paul  United States Minnesota Wild ( NHL) (2000–present)
26 Ball Arena* 18,007 [23] Denver  United States Colorado Avalanche ( NHL) (1999–present)
27 Madison Square Garden* 18,006 [24] New York City  United States New York Rangers ( NHL) (1968–present)
28 TD Garden* 17,565 [25] Boston  United States Boston Bruins ( NHL) (1995–present)
29 SAP Center at San Jose* 17,562 [26] San Jose  United States San Jose Sharks ( NHL) (1993–present), San Jose Barracuda ( AHL) (2015–present)
30 Value City Arena 17,500 [27] Columbus  United States Ohio State Buckeyes men's ice hockey ( NCAA) (1998–present)
31 T-Mobile Arena* 17,500 [28] Las Vegas  United States Vegas Golden Knights ( NHL) (2017–present)
32 FirstOntario Centre 17,383[ citation needed] Hamilton  Canada Hamilton Bulldogs ( OHL) (2015–present), Hamilton Bulldogs ( AHL) (1996-2015)
33 O2 Arena 17,360[ citation needed] Prague   Czech Republic HC Sparta Praha ( Czech Extraliga) (2015–present), HC Slavia Praha ( Czech Extraliga, 2004–2015), HC LEV Praha ( KHL, 2012–2014)
34 UBS Arena* 17,255 [29] Hempstead  United States New York Islanders ( NHL) (2021–present)
35 Honda Center* 17,174 [30] Anaheim  United States Anaheim Ducks ( NHL) (1993–present)
36 Desert Diamond Arena 17,125 [31] Glendale  United States Arizona Coyotes ( NHL) (2003–2022)
37 Bridgestone Arena* 17,159 [32] Nashville  United States Nashville Predators ( NHL) (1998–present)
38 Climate Pledge Arena* 17,151 [33] Seattle  United States Seattle Kraken ( NHL) (2021–present)
39 BOK Center 17,096 [34] Tulsa  United States Tulsa Oilers ( ECHL) (2008–present)
40 PostFinance-Arena 17,031[ citation needed] Bern Switzerland Switzerland SC Bern ( NLA) (1967–present)
41 Allstate Arena 16,692[ citation needed] Rosemont  United States Chicago Wolves ( AHL) (1994–present)
42 Prudential Center* 16,514 [35] Newark  United States New Jersey Devils ( NHL) (2007–present)
43 Barclays Center 15,813 Brooklyn  United States New York Islanders ( NHL) (2015–2020)
44 XL Center 15,564 [36] [38] Hartford  United States New England Whalers ( WHA) (1975–1978), Hartford Whalers ( NHL) (1980–1997),
Hartford Wolf Pack ( AHL) (1997–present), Connecticut Huskies ( NCAA) (2014–present)
45 Wells Fargo Arena 15,581[ citation needed] Des Moines  United States Iowa Stars ( AHL) (2005–2009), Iowa Chops ( AHL) (2005–2009), Iowa Wild ( AHL) (2013–present)
46 Canada Life Centre* 15,294 [39] Winnipeg  Canada Winnipeg Jets ( NHL) (2011–present), Manitoba Moose ( AHL) (2004–2011, 2015–present)
47 Kohl Center 15,237 [40] Madison  United States Wisconsin Badgers men's ice hockey ( NCAA) (1998–present) [41]
48 SaskTel Centre 15,195[ citation needed] Saskatoon  Canada Saskatoon Blades ( WHL) (1988–present), Saskatchewan Rush ( NLL) (2016–present)
49 Minsk-Arena 15,086 Minsk   Belarus Dinamo Minsk ( KHL) (2008–present)

Defunct arenas by seating

In this table, "defunct" refers to its status as an ice hockey venue. Many of the venues listed here remain in use for other sports.

Rank Arena Capacity City Country Home Team(s) (League, Dates)
1 Thunderdome 28,183 [42] [43] St. Petersburg  United States Tampa Bay Lightning ( NHL) (1993–1996)
2 Greensboro Coliseum Complex 21,273[ citation needed] Greensboro  United States Carolina Hurricanes ( NHL) (1997–1999), Carolina Monarchs ( AHL) (1995–1997), Greensboro Monarchs ( ECHL) (1989–1995)
3 The Palace 20,804[ citation needed] Auburn Hills  United States Detroit Vipers ( IHL) (1994–2001)
4 Joe Louis Arena 20,027 [44] Detroit  United States Detroit Red Wings ( NHL) (1979–2017)
5 Vélodrome d'hiver 20,000 Paris  France Club des Patineurs ( Championnat de France) (1931–1937), Racing Club ( Championnat de France) (1931–1933),
Stade Français ( Championnat de France) (1931–1937), Français Volants ( Championnat de France) (1933–1938)
6 Izod Center 19,040[ citation needed] East Rutherford  United States New Jersey Devils ( NHL) (1982–2007)
7 Richfield Coliseum 18,544 Richfield, Ohio  United States Cleveland Crusaders ( WHA) (1974–76), Cleveland Barons (NHL) (1976–78)
8 Capital Centre 18,130[ citation needed] Landover  United States Washington Capitals ( NHL) (1974–97)
9 Chesapeake Energy Arena 18,036[ citation needed] Oklahoma City  United States Oklahoma City Blazers ( CHL) (2002–2009)
10 BMO Harris Bradley Center 17,845[ citation needed] Milwaukee  United States Milwaukee Admirals ( AHL) (1988–2016)
11 Toyota Center 17,800[ citation needed] Houston  United States Houston Aeros ( AHL) (2003–2013)
12 Kemper Arena 17,647[ citation needed] Kansas City  United States Kansas City Scouts ( NHL) (1974–1976), Kansas City Blues ( CHL) (1976–1977),
Kansas City Blades ( IHL) (1990–2001), Kansas City Outlaws ( UHL) (2004–2005)
13 Philips Arena 17,624[ citation needed] Atlanta  United States Atlanta Thrashers ( NHL) (1999–2011)
14 Manchester Arena 17,500[ citation needed] Manchester United Kingdom United Kingdom Manchester Storm (1995–2002)
15 Wachovia Spectrum 17,380[ citation needed] Philadelphia  United States Philadelphia Flyers ( NHL) (1967–1996), Philadelphia Phantoms ( AHL) (1996–2009)
16 Chicago Stadium 17,317[ citation needed] Chicago United States United States Chicago Blackhawks ( NHL) (1929–1994)
17 St. Louis Arena 17,188 St. Louis United States United States St. Louis Eagles ( NHL) (1934–1935), St. Louis Blues (NHL) (1967–1994)
18 Reunion Arena 17,001[ citation needed] Dallas  United States Dallas Stars ( NHL) (1993–2001)
19 Verizon Arena 17,000[ citation needed] North Little Rock  United States Arkansas RiverBlades ( ECHL) (1999–2003)
20 Civic Arena 16,958[ citation needed] Pittsburgh  United States Pittsburgh Hornets ( AHL) (1961–1967), Pittsburgh Penguins ( NHL) (1967–2010)
21 Northlands Coliseum 16,839[ citation needed] Edmonton  Canada Edmonton Oilers ( NHL) (1979–2016), Edmonton Oilers ( WHA) (1974–1979), Edmonton Oil Kings ( WHL) (1974–1976, 2007–2016)
22 Buffalo Memorial Auditorium 16,433[ citation needed] Buffalo  United States Buffalo Bisons ( AHL) (1940–1970), Buffalo Sabres ( NHL) (1970–1996)
23 Montreal Forum 16,400 [45] Montreal  Canada Montreal Maroons ( NHL) (1924–1938), Montreal Canadiens ( NHL) (1926–1996), Montreal Junior Canadiens ( QJHL, ( OHA) (1933–1972),
Montreal Voyageurs ( AHL) (1969–1971), Montreal Bleu Blanc Rouge ( QMJHL) (1972–1975), Montreal Juniors ( QMJHL) (1975–1982)
24 Maple Leaf Gardens 16,307 [46] Toronto  Canada Toronto Maple Leafs ( NHL) (1931–1999), Toronto Marlboros ( OHL) (1931–1989), Toronto Toros ( WHA) (1974–1976)
25 Pacific Coliseum 16,281 [47] Vancouver  Canada Vancouver Canucks ( WHL) (1968–1970), Vancouver Canucks ( NHL) (1970–1995), Vancouver Nats ( WHL) (1971–1973),
Vancouver Blazers ( WHA) (1973–1975), Vancouver Voodoo ( RHI) (1994–1995), Vancouver Giants ( WHL) (2001–2016)
26 Nassau Veterans Memorial Coliseum 16,234 [48] Uniondale  United States New York Islanders ( NHL) (1972–2015, 2017-2020)
27 US Airways Center 16,210 [49] Phoenix  United States Phoenix Coyotes ( NHL) (1996–2003), Phoenix RoadRunners ( ECHL) (2005–2009)
28 McNichols Sports Arena 16,061[ citation needed] Denver  United States Colorado Rockies (NHL) (1976–1982), Colorado Flames ( CHL) (1982–1984), Denver Grizzlies ( IHL) (1994–1995), Colorado Avalanche ( NHL) (1995–1999)
29 The Forum 16,005[ citation needed] Inglewood  United States Los Angeles Kings ( NHL) (1967–1999)
30 CenturyLink Center Omaha 15,959 [50] Omaha  United States Omaha Mavericks men's ice hockey ( NCAA) (2003–2015)
31 Amway Arena 15,948 Orlando  United States Orlando Solar Bears ( IHL) (1995–2001), Orlando Seals ( ACHL) (2002–2004)
32 Madison Square Garden (III) 15,925[ citation needed] New York City  United States New York Rangers ( NHL) (1926–1968), New York Americans ( NHL) (1925–1942)
33 Winnipeg Arena 15,565[ citation needed] Winnipeg  Canada Winnipeg Warriors ( WHL) (1955–1961), Winnipeg Monarchs ( WHL), Winnipeg Jets ( WHA, NHL) (1972–1996),
Winnipeg Warriors ( WHL) (1980–1984), Manitoba Moose ( IHL, AHL) (1996–2004)
34 Omni Coliseum 15,278[ citation needed] Atlanta  United States Atlanta Flames ( NHL) (1972–1980), Atlanta Knights ( IHL) (1992–1996)
35 Colisée Pepsi 15,176 [51] Quebec City  Canada Quebec Aces (AHL) (1959–1971), Quebec Nordiques ( WHA),( NHL) (1972–1995), Quebec Rafales ( IHL) (1996–1998),
Quebec Citadelles ( AHL) (1999–2002), Quebec Remparts ( QMJHL) (1969–1985, 1999–2015)
36 London Arena 15,000 London   United Kingdom London Knights
37 Detroit Olympia 15,000[ citation needed] Detroit  United States Detroit Cougars/Falcons/Red Wings ( NHL) (1927–1979)
38 Met Center 15,000[ citation needed] Bloomington  United States Minnesota North Stars ( NHL) (1967–1993)
39 Boston Garden 14,448 [52] Boston  United States Boston Bruins ( NHL) (1928–1995), Boston Braves ( AHL) 1971–1974, New England Whalers ( WHA) 1972–1974

See also

References

  1. ^ "Centre Bell – Our History". www.centrebell.ca. Retrieved 2016-05-23.
  2. ^ "Cleveland Cavaliers vs. Chicago Bulls". Chicago Tribune. Archived from the original on 2014-03-03. Retrieved 2016-05-23.
  3. ^ hockeyattendance.com – Philadelphia Flyers 2013–2014 Attendance, Accessed March 23, 2014.
  4. ^ "Joe Louis Arena History and Facts". redwings.nhl.com. Retrieved 2016-05-23.
  5. ^ Barnes, Dan. "Alberta bid targets $18 million in profits" Archived 2008-09-06 at the Wayback Machine, The Vancouver Sun, August 28, 2008. Accessed September 22, 2008. "Rexall Place seats 16,839 and will host Team Canada's early-round games, while Pengrowth Saddledome, site of the medal round games, holds 19,289."
  6. ^ "Facts and Figures". Archived from the original on 2012-02-08. Retrieved 2012-04-22.
  7. ^ ""Tampa Bay Lightning owner: No immediate plans to seek renovation reimbursement"". Archived from the original on 2013-12-19. Retrieved 2014-02-07.
  8. ^ Vogl, John. "Only single seats remain for Amerks' game in Buffalo on Friday as team will set franchise attendance record" Archived 2012-12-31 at the Wayback Machine, The Buffalo News, December 27, 2012. Accessed December 29, 2012. "The Sabres have added and reconfigured seats, primarily in the 200 Level, and will now host 19,070 fans. The number is symbolic of the team's 1970 founding. Previous capacity was 18,690."
  9. ^ "About Quicken Loans Arena". www.theqarena.com. Retrieved 2017-10-30.
  10. ^ hockeyattendance.com – Vancouver Canucks 2013–2014 Attendance, Accessed March 23, 2014.
  11. ^ hockeyattendance.com – Toronto Maple Leafs 2013–2014 Attendance
  12. ^ "PNC Arena :: Arena Info". Archived from the original on 5 December 2014.
  13. ^ "Ottawa Senators vs. Philadelphia Flyers Fri • Nov 15 • 7:30 PM Canadian Tire Centre, Ottawa, ON". Ticketmaster. Retrieved November 15, 2019.
  14. ^ hockeyattendance.com – Washington Capitals 2013–2014 Attendance, Accessed March 23, 2014.
  15. ^ Center Venues Archived 2008-09-13 at the Wayback Machine, American Airlines Center. Accessed September 25, 2008. "Since opening in July 2001, the American Airlines Center has set a new standard for sports and entertainment and has become the premier venue of the South. Its grand complex with sweeping vistas and inviting passages comprise five concourses, 142 luxury suites and rooms for 20,000 fans or 18,532 hockey fans."
  16. ^ "Kölner Haie – Arena Fakten". Retrieved 2010-01-06.
  17. ^ Anderson, Shelly. "Penguins add 300 seats at Consol Energy Center", Pittsburgh Post-Gazette, August 16, 2011. Accessed December 2, 2011. The Penguins have added 300 seats for games at Consol Energy Center, bringing the capacity to 18,387 for the second season at the arena.
  18. ^ lecentrevideotron.ca – Site Specification
  19. ^ hockeyattendance.com – Los Angeles Kings 2013–2014 Attendance, Accessed March 23, 2014.
  20. ^ hockeyattendance.com – Columbus Blue Jackets 2013–2014 Attendance, Accessed March 23, 2014.
  21. ^ Scottrade Center Facts Archived 2008-10-10 at the Wayback Machine, Scottrade Center. Accessed September 25, 2008. "The 664,000-square-foot (61,700 m2) Scottrade Center seats 19,150 for hockey and nearly 22,000 for basketball, concerts and other floor-seating events."
  22. ^ hockeyattendance.com – Minnesota Wild 2013–2014 Attendance, Accessed March 23, 2014.
  23. ^ "Pepsi Center: Arena Facts". Archived from the original on 2008-12-18. Retrieved 2008-11-23.
  24. ^ DeLessio, Joe (October 24, 2013). "Here's What the Renovated Madison Square Garden Looks Like". New York Magazine. Retrieved October 24, 2013.
  25. ^ hockeyattendance.com – Boston Bruins 2019–2020 Attendance, Accessed March 23, 2014.
  26. ^ hockeyattendance.com – San Jose Sharks 2013–2014 Attendance, Accessed March 23, 2014.
  27. ^ "Schottenstein Center :: Arena Information". Archived from the original on 2014-03-23. Retrieved 2013-08-21.
  28. ^ "NHL officially OKs Las Vegas as 31st franchise". ESPN.com. 22 June 2016. Retrieved 2016-06-22.
  29. ^ https://www.nhl.com/islanders/arena/belmont nhl.com - Introducing UBS Arena
  30. ^ hockeyattendance.com – Anaheim Ducks 2013–2014 Attendance, Accessed March 23, 2014.
  31. ^ hockeyattendance.com – Arizona Coyotes 2013–2014 Attendance, Accessed March 23, 2014.
  32. ^ hockeyattendance.com – Nashville Predators 2013–2014 Attendance, Accessed March 23, 2014.
  33. ^ climatepledgearena.com - Climate Pledge Arena Overview, Accessed February 9, 2021.
  34. ^ "Inside the BOK center" (PDF). Tulsa World. Retrieved 2008-08-30.
  35. ^ Chere, Rich (2015-11-06). "Travis Zajac sparks Devils' rout of Chicago Blackhawks, 4-2 | Rapid reaction". NJ Advance Media for NJ.com. Retrieved 2016-11-02.
  36. ^ "Arena Info | XL CENTER".
  37. ^ "Facilities: XL Center". Connecticut Huskies. Retrieved 2018-08-06.
  38. ^ The University of Connecticut does not use the entire capacity of XL Center for its men's hockey games. It sells tickets only in the arena's lower bowl, resulting in a capacity of 8,089. [37]
  39. ^ globalnews.ca – MTS Centre in Winnipeg unveils new scoreboard, seats
  40. ^ "Facilities: Kohl Center". Wisconsin Badgers. Retrieved January 18, 2016.
  41. ^ The Kohl Center also hosted Wisconsin Badgers women's ice hockey from 1998 to 2012. The women's team now plays in its own facility, the considerably smaller LaBahn Arena.
  42. ^ This venue was built for baseball and has a much larger capacity than any hockey-specific arena ever built, but it was never filled to capacity in the three years ice hockey was played there. The record for a Stanley Cup playoff game — 28,183 — was set here on April 23, 1996, during a Tampa Bay LightningPhiladelphia Flyers game.
  43. ^ Hackel, Stu (January 2, 2009). "The Morning Skate: Assessing the Winter Classic". The New York Times. Retrieved May 8, 2010.
  44. ^ "Arena Info: General Information". The Detroit Red Wings. Archived from the original on November 1, 2012. Retrieved December 8, 2012.
  45. ^ Total capacity of 17,959 with approximately 1,600 in standing room subtracted.
  46. ^ Maple Leaf Gardens: Fifty Years Of History, Stan Obodiac, Van Nostrand Reinhold Ltd., 1981
  47. ^ "Pacific Coliseum – Vancouver | Tickets, Schedule, Seating Chart, Directions". Ticketmaster.ca. Retrieved 2013-03-02.
  48. ^ "Seating capacities of the 30 NHL arenas". .canada.com. 2007-05-02. Archived from the original on 2012-03-29. Retrieved 2013-03-02.
  49. ^ http://www.phoenixnewtimes.com/music/us-airways-center-renamed-talking-stick-resort-arena-6616024 – Talking Stick Resort Arena (capacity 18,422).
  50. ^ "CenturyLink Center Omaha". Archived from the original on 2013-09-01. Retrieved 2013-08-21.
  51. ^ Pat Hickey (4 January 2012). "Canadian teams rake in cash". Archived from the original on 6 February 2015. Retrieved 8 May 2015..
  52. ^ and, Fox Butterfield (17 February 1993). "Hopes for a New Boston Garden Dim With Political Quarreling". The New York Times. Retrieved 2018-08-01.