
Original file (837 × 436 pixels, file size: 41 KB, MIME type: image/png)
| This is a file from the
Wikimedia Commons. Information from its
description page there is shown below. Commons is a freely licensed media file repository. You can help. |
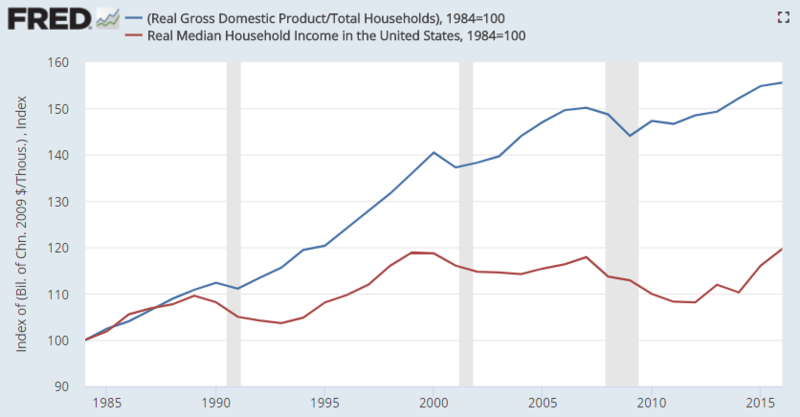
Understanding the chart
This chart shows how U.S. economic growth is not translating to higher family incomes. U.S. real GDP per household, a measure of average total income per household, has increased since 2000 while the real median income per household did not regain 1999 levels again until 2016, indicating a trend of greater income inequality. [1] [2]
An average is more distorted by high income outliers than the median (e.g., if a billionaire walks into a room of factory workers, the average or mean income goes up enormously but the median barely changes). The term "real" means the figures are adjusted for inflation. The numbers are indexed to show percent change (i.e., the 135 represents a 35% increase since the 1993 base period). The concept is further explained in the NYT article referenced. The GDP data in the graph above is through 2015.
Mathematically, when the average (mean) grows faster than the median (half of the households are above the median, half are below), a greater share of the income is going to families at the top of the income distribution. When the mean and median grow about the same, that indicates a more even distribution of income.
According to the FRED blog, the definition of income used in the two lines are different: "Household income is based on a survey that asks people about only their income, not their employer-provided benefits and retirement contributions. In a previous post, we showed that these benefits have increased relatively more than wages. Real GDP includes all income in the economy. Second, if the distribution of income becomes more unequal, then the median decreases while the mean stays put. How much each of these contribute to the remaining gap can only be determined with a look at the microdata." [3]
Summary
| Description |
English: FRED data showing United States real GDP per capita vs. real median household income. This indicates a trend of increasing income inequality. GDP per capita (a measure of average or mean total income) is not translating to median wage increases, indicating a small fraction of the population is capturing the income increase. Refer to NYT article linked in the file description for similar graph and narrative. |
| Date | |
| Source |
FRED database graph |
| Author | Farcaster |
References
Licensing
| This chart is ineligible for
copyright and therefore in the
public domain, because it consists entirely of information that is common property and contains no original authorship. For more information, see
Commons:Threshold of originality § Charts
|
File history
Click on a date/time to view the file as it appeared at that time.
| Date/Time | Thumbnail | Dimensions | User | Comment | |
|---|---|---|---|---|---|
| current | 04:18, 26 February 2018 |
| 837 × 436 (41 KB) | Farcaster | Update for 2016 but change real gdp per capita to real gdp per household, for more accurate comparison |
| 23:22, 2 November 2017 |
 | 928 × 480 (35 KB) | Farcaster | Update for latest info through 2016 | |
| 04:18, 12 January 2017 |
 | 943 × 437 (29 KB) | Farcaster | Update | |
| 18:12, 22 December 2015 |
 | 811 × 448 (36 KB) | Khamar | update includes more recent data, available at [https://research.stlouisfed.org/fred2/graph/?graph_id=195323# Federal Reserve Bank of St. Louis.] | |
| 16:38, 21 September 2014 |
 | 2,680 × 1,780 (216 KB) | Farcaster | Uploading a self-made file using File Upload Wizard |
File usage
Global file usage
The following other wikis use this file:
- Usage on vi.wikipedia.org