No higher resolution available.
Solar-cycle-data.png (700 × 466 pixels, file size: 37 KB, MIME type: image/png)
| This is a file from the
Wikimedia Commons. Information from its
description page there is shown below. Commons is a freely licensed media file repository. You can help. |
Summary
| Description |
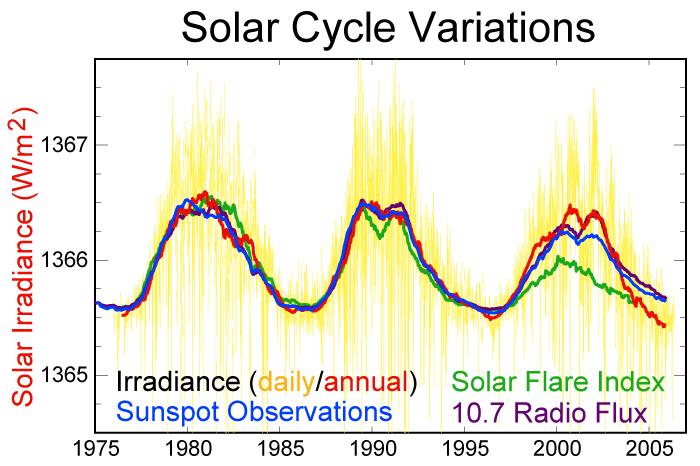
العربية: التباينُ الشمسي في الفترة الممتدة من 1975 حتى 2005 (30 سنة).
English: This picture depicts the last three
solar cycles as measured in
solar irradiance,
sunspot numbers,
solar flare activity, and 10.7 cm
radio flux. Solar irradiance, i.e the direct solar power at the top of the
Earth's atmosphere, is depicted as both a daily measurement and a moving annual
average. All other data are depicted as the annual average value.
Español: Variaciones en el ciclo solar.
Suomi: Auringon aktiivisuuden syklit aikavälillä 1975–2005. |
| Date | |
| Source | Original graphic by Robert A. Rohde |
| Author | Robert A. Rohde |
| Other versions |
|


|
This graph image could be re-created using
vector graphics as an
SVG file. This has several advantages; see
Commons:Media for cleanup for more information. If an SVG form of this image is available, please upload it and afterwards replace this template with
{{
vector version available|new image name}}
.
It is recommended to name the SVG file “Solar-cycle-data.svg”—then the template Vector version available (or Vva) does not need the new image name parameter. |
Copyright
This image was created by Robert A. Rohde from the published data listed below and replaces an image created by William M. Connolley. It is part of the Global Warming Art project.
Image from Global Warming Art
This image is an original work created for
Global Warming Art. Please refer to the
image description page for more information.

|
Permission is granted to copy, distribute and/or modify this document under the terms of the GNU Free Documentation License, Version 1.2 or any later version published by the Free Software Foundation; with no Invariant Sections, no Front-Cover Texts, and no Back-Cover Texts. A copy of the license is included in the section entitled GNU Free Documentation License. |
| This file is licensed under the Creative Commons Attribution-Share Alike 3.0 Unported license. | ||
| ||
| This licensing tag was added to this file as part of the GFDL licensing update. |
Data sources
- Irradiance: http://www.pmodwrc.ch/pmod.php?topic=tsi/composite/SolarConstant
- International sunspot number: http://www.ngdc.noaa.gov/stp/SOLAR/ftpsunspotnumber.html
- Flare index: http://www.koeri.boun.edu.tr/astronomy/readme.html
- 10.7cm radio flux: http://www.drao-ofr.hia-iha.nrc-cnrc.gc.ca/icarus/www/sol_home.shtml
References
File history
Click on a date/time to view the file as it appeared at that time.
| Date/Time | Thumbnail | Dimensions | User | Comment | |
|---|---|---|---|---|---|
| current | 08:31, 1 February 2008 |
| 700 × 466 (37 KB) | Xiong Chiamiov | optimized using optipng |
| 20:12, 20 July 2006 |
 | 700 × 466 (44 KB) | Nils Simon | == Description == thumb|right|350px|Variations in sunspot number since 1610. thumb|right|250px|Changes in solar activity since 1400. This picture depicts the last three solar cycles | |
| 12:55, 24 May 2005 |
 | 753 × 565 (9 KB) | Xenoforme~commonswiki | Pic of 20 years of solar output data. Created by William M. Connolley using IDL. Data source: http://www.pmodwrc.ch/dat/composite_d19.asc which is linked from http://www.grida.no/climate/ipcc_ta |
File usage
The following pages on the English Wikipedia use this file (pages on other projects are not listed):
- Global Energy and Water Exchanges
- Gnevyshev–Ohl rule
- List of solar cycles
- Solar cycle
- Solar cycle 1
- Solar cycle 10
- Solar cycle 11
- Solar cycle 12
- Solar cycle 13
- Solar cycle 14
- Solar cycle 15
- Solar cycle 16
- Solar cycle 17
- Solar cycle 18
- Solar cycle 19
- Solar cycle 2
- Solar cycle 20
- Solar cycle 21
- Solar cycle 22
- Solar cycle 23
- Solar cycle 24
- Solar cycle 25
- Solar cycle 3
- Solar cycle 4
- Solar cycle 5
- Solar cycle 6
- Solar cycle 7
- Solar cycle 8
- Solar cycle 9
- Solar maximum
- Solar minimum
- Sun
- Talk:Climate change/Archive 22
- Talk:Climate change/Archive 23
- Talk:Climate change/Archive 67
- User:Dragons flight/Images
- User:Mporter/Climate data
- User:Mytwocents/Globalnull Warmingnull
- User:UBeR/GWcleanup
- Template:Solar cycles
Global file usage
The following other wikis use this file:
- Usage on ar.wikipedia.org
- Usage on ast.wikipedia.org
- Usage on be.wikipedia.org
- Usage on bg.wikipedia.org
- Usage on cbk-zam.wikipedia.org
- Usage on cs.wikipedia.org
- Usage on da.wikipedia.org
- Usage on de.wikipedia.org
- Usage on en.wikiversity.org
- Usage on es.wikipedia.org
- Usage on eu.wikipedia.org
- Usage on fa.wikipedia.org
- Usage on fi.wikipedia.org
- Usage on fr.wikipedia.org
- Usage on gl.wikipedia.org
- Usage on he.wikipedia.org
- Usage on hi.wikipedia.org
- Usage on hr.wikipedia.org
- Usage on hu.wikipedia.org
- Usage on id.wikipedia.org
- Usage on it.wikipedia.org
- Usage on ja.wikipedia.org
View more global usage of this file.