
Size of this PNG preview of this SVG file:
750 × 440 pixels. Other resolutions:
320 × 188 pixels |
640 × 375 pixels |
1,024 × 601 pixels |
1,280 × 751 pixels |
2,560 × 1,502 pixels.
Original file (SVG file, nominally 750 × 440 pixels, file size: 15 KB)
| This is a file from the
Wikimedia Commons. Information from its
description page there is shown below. Commons is a freely licensed media file repository. You can help. |
Summary
| Description |
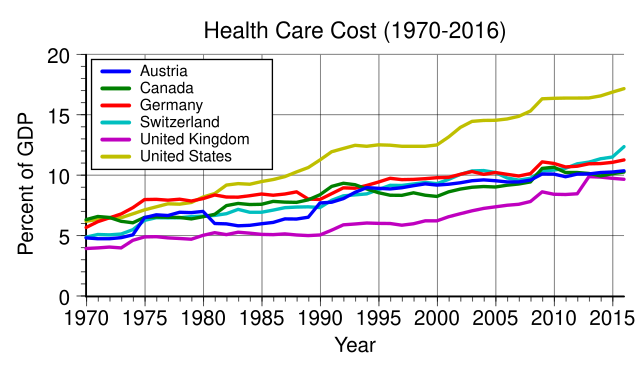
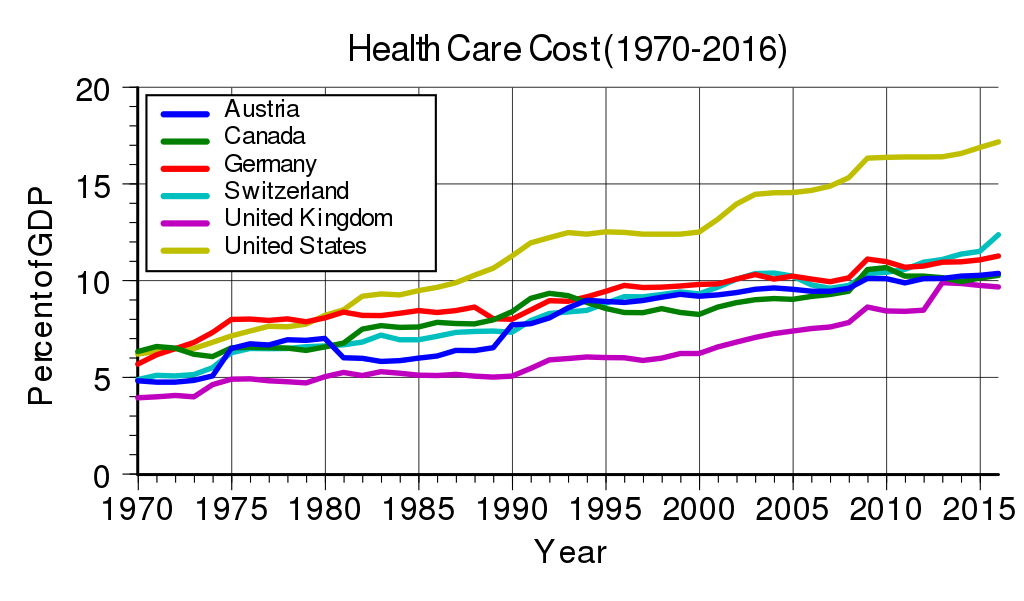
English: Health care cost rise based on total expenditure on health as percent of GDP. Countries are USA, Germany, Austria, Switzerland, United Kingdom, and Canada. See:
OECD iLibrary. Health expenditure and financing. And:
OECD Data. Health resources - Health spending . See also:
en:List of countries by total health expenditure per capita. |
| Date | (date of first version of the chart here on the Commons). |
| Source | Own work |
| Author | WikiBasti |
| Other versions | Health care cost rise.PNG |
| SVG development | This
vector image was created with an unknown SVG tool. This file uses embedded text that can be
easily translated using a text editor. |
Generated with Wikimedia SVG Chart
| Data format | The source data of the chart is in the SVG image file in a clearly readable format. You see the original numbers inside of the SVG file in the form of a list such as this:
... 1995 10.06 1996 11.75 1997 12.45 ... |
| Content of SVG | To view the data download the SVG file itself. To do so right-click this link, and then choose the option to save:
File:Health care cost rise.svg. Launch any
text editor. Open the downloaded SVG file with the text editor (usually; file menu, open). To see the list of data, search for the phrase id="graph1". |
|
|
Please, do not use a special SVG editor such as Inkscape; the readability of the database would be destroyed. You can edit the SVG file with any
text editor, for example;
en: List of text editors. You can view the edited SVG file in various web browsers. As of 2011, all major desktop browsers, and many minor ones, have some level of SVG support. See:
en: Scalable Vector Graphics#Support for SVG in web browsers. When satisfied with your edits, upload the edited SVG file with the link labeled "Upload a new version of this file".
W3C-validity not checked. This
chart was created with
Wikimedia SVG Chart. This
chart uses embedded text/digits. |
| Code to generate SVG | See: File talk:Health care cost rise.svg. Documentation see: Wikimedia SVG Chart. |
Licensing
| I, the copyright holder of this work, release this work into the
public domain. This applies worldwide. In some countries this may not be legally possible; if so: I grant anyone the right to use this work for any purpose, without any conditions, unless such conditions are required by law. |
File history
Click on a date/time to view the file as it appeared at that time.
| Date/Time | Thumbnail | Dimensions | User | Comment | |
|---|---|---|---|---|---|
| current | 21:10, 8 October 2017 |
| 750 × 440 (15 KB) | Delphi234 | update |
| 15:15, 11 September 2016 |
 | 750 × 440 (15 KB) | Delphi234 | update | |
| 02:02, 17 May 2016 |
 | 750 × 440 (15 KB) | Delphi234 | update | |
| 13:15, 24 March 2010 |
 | 896 × 420 (30 KB) | WikiBasti | different size | |
| 13:13, 24 March 2010 |
| 860 × 240 (30 KB) | WikiBasti | different size | |
| 12:44, 24 March 2010 |
 | 512 × 240 (30 KB) | WikiBasti | {{Information |Description={{en|1=Data Source [http://www.irdes.fr/EcoSante/DownLoad/OECDHealthData_FrequentlyRequestedData.xls] (OECD Health Data 2009). Health care cost rise based on total expenditure on health as % of GDP. Countries are USA, Germany, A |
File usage
The following pages on the English Wikipedia use this file (pages on other projects are not listed):
Global file usage
The following other wikis use this file:
- Usage on ar.wikipedia.org
- Usage on az.wikipedia.org
- Usage on de.wikipedia.org
- Usage on es.wikipedia.org
- Usage on fa.wikipedia.org
- Usage on ja.wikipedia.org
- Usage on ko.wikipedia.org
- Usage on pl.wikipedia.org
- Usage on pt.wikipedia.org
- Usage on ru.wikipedia.org
- Usage on sr.wikipedia.org
- Usage on sv.wikipedia.org
- Usage on zh.wikipedia.org