
Size of this PNG preview of this SVG file:
800 × 579 pixels. Other resolutions:
320 × 232 pixels |
640 × 463 pixels |
1,024 × 742 pixels |
1,280 × 927 pixels |
2,560 × 1,854 pixels |
1,900 × 1,376 pixels.
Original file (SVG file, nominally 1,900 × 1,376 pixels, file size: 54 KB)
| This is a file from the
Wikimedia Commons. Information from its
description page there is shown below. Commons is a freely licensed media file repository. You can help. |
| Description |
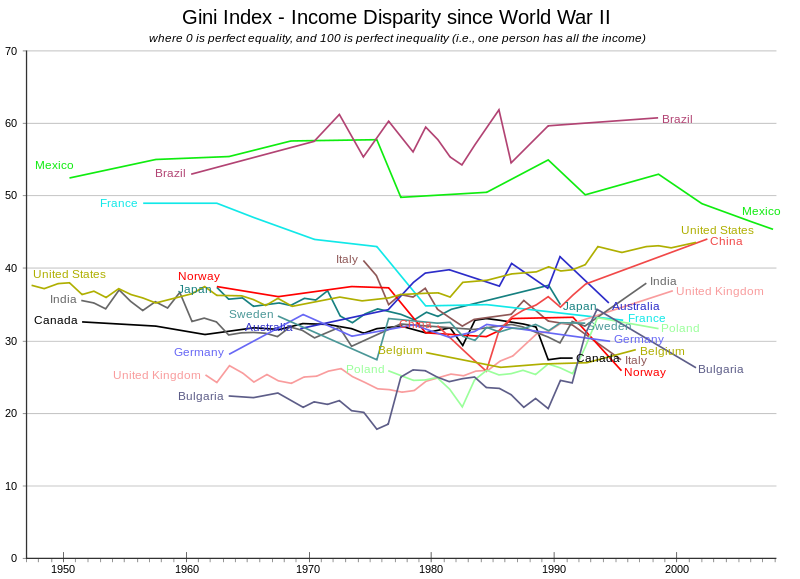
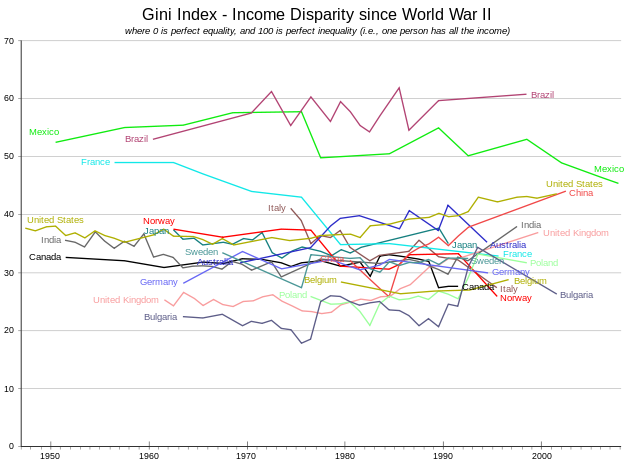
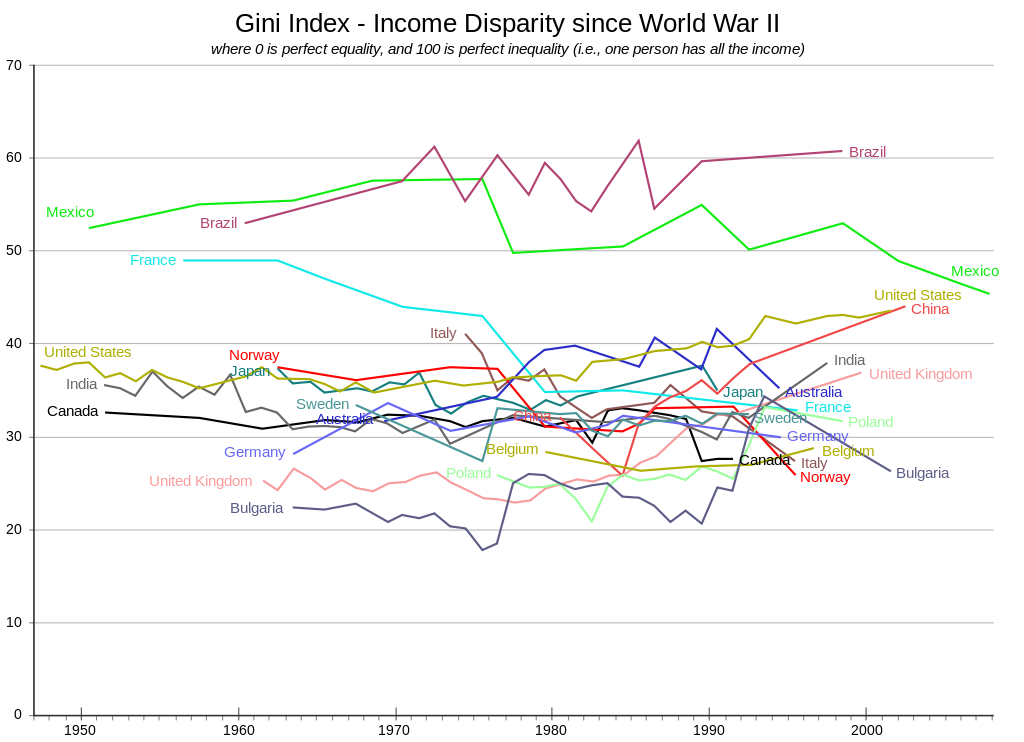
English: Gini indices of selected countries are from publicly available data from the World Bank, Nationmaster, and the US Census Bureau.
The Gini index is the
Gini coefficient expressed as a percentage, and is equal to the Gini coefficient multiplied by 100. The Gini coefficient is a
measure of statistical dispersion most prominently used as a
measure of inequality of income distribution or
inequality of wealth distribution. It is defined as a
ratio with values between 0 and 1: A low Gini coefficient indicates more equal income or wealth distribution, while a high Gini coefficient indicates more unequal distribution. 0 corresponds to perfect equality (everyone having exactly the same income) and 1 corresponds to perfect inequality (where one person has all the income, while everyone else has zero income). The Gini coefficient requires that no one have a negative net income or wealth. Worldwide, Gini coefficients range from approximately 0.249 in Japan to 0.707 in Namibia. |
||
| Date | |||
| Source |
Own work. Derived from
|
||
| Author | Cflm001 ( talk) | ||
| Permission ( Reusing this file) |
I, the copyright holder of this work, hereby publish it under the following licenses:
This file is licensed under the
Creative Commons
Attribution-Share Alike 3.0 Unported license.
You may select the license of your choice. |
||
| Other versions |
 |
||
| SVG development | This diagram was created with
Inkscape, or with something else. This diagram uses embedded text that can be
easily translated using a text editor. |

File history
Click on a date/time to view the file as it appeared at that time.
| Date/Time | Thumbnail | Dimensions | User | Comment | |
|---|---|---|---|---|---|
| current | 16:10, 27 September 2009 |
| 1,900 × 1,376 (54 KB) | Cflm001 | adding Germany and Sweden start labels. Synching Poland label colour with line |
| 13:55, 27 September 2009 |
 | 1,900 × 1,376 (53 KB) | Cflm001 | {{Information |Description={{en|1=Gini indices of selected countries are from publicly available data from the World Bank, Nationmaster, and the US Census Bureau. The Gini index is the Gini coefficient expressed as a percentage |
File usage
The following pages on the English Wikipedia use this file (pages on other projects are not listed):
Global file usage
The following other wikis use this file:
- Usage on ast.wikipedia.org
- Usage on bg.wikipedia.org
- Usage on cs.wikipedia.org
- Usage on el.wikipedia.org
- Usage on es.wikipedia.org
- Usage on et.wikipedia.org
- Usage on fr.wikipedia.org
- Usage on it.wikipedia.org
- Usage on ja.wikipedia.org
- Usage on ms.wikipedia.org
- Usage on no.wikipedia.org
- Usage on ru.wikipedia.org
- Usage on sv.wikipedia.org
- Usage on tt.wikipedia.org
- Usage on vi.wikipedia.org
- Usage on zh.wikipedia.org