| Demographics of Northern Ireland | |
|---|---|
 Population pyramid of Northern Ireland in 2020 | |
| Population | 1,903,175 (2021 census) |
| Density | 133 per km2 |
| Life expectancy | |
| • male | 77.2 years |
| • female | 80.8 years |
| Age structure | |
| 0–14 years | 19% |
| 15–64 years | 64% |
| 65 and over | 17% |
| Nationality | |
| Major ethnic | White 97% |
| Minor ethnic | other ethnic groups 3% |

Northern Ireland is the smallest of the four components of the United Kingdom in terms of both area and population, containing 2.9% of the total population and 5.7% of the total area of the United Kingdom. It is the smaller of the two political entities on the island of Ireland by area and population, the other being the Republic of Ireland. Northern Ireland contains 27.1% of the total population and 16.75% of the total area of the island of Ireland.
The Belfast Metropolitan Area dominates in population terms, with over a third of the inhabitants of Northern Ireland.
When Northern Ireland was created, it had a Protestant majority of approximately two-to-one, [1] [2] [3] unlike the Republic of Ireland, where Catholics were in the majority. [4] The 2001 census was the first to show that the Protestant and other (non-Catholic) Christian share of the population had dropped below 50%, but 53.1% still identified as being from a Protestant or other Christian background. In the 2011 census, this dropped to 48.4%. [5] [3] In 2021, the recorded number of Catholics by background (45.7%) overtook the Protestant and other Christian by background share (43.48%), becoming the plurality, with no group in the overall majority. [6] [7] [8] [9]
Its people speak Irish (Gaelic), Ulster Scots and Ulster English which is itself heavily influenced by the Scots language of which Ulster Scots is a dialect. In addition the Ulster dialect of Irish (Gaelic) also has a closer connection to Scottish Gaelic than other Irish (Gaelic) dialects. This is both because of historic links with Scotland going back centuries, and because of settlements of lowland Scots Protestants in Ulster in the 17th century, such as the Plantation of Ulster.
Also unlike the Republic, a large proportion of people in Northern Ireland have a British national identity, although a significant minority identifies as Irish. Many people in Northern Ireland have a Northern Irish identity, whether in addition to a British or Irish identity or by itself.

Historic population trends
| Year | Pop. | ±% |
|---|---|---|
| 1841 | 1,648,945 | — |
| 1851 | 1,442,517 | −12.5% |
| 1861 | 1,396,453 | −3.2% |
| 1871 | 1,359,190 | −2.7% |
| 1881 | 1,304,816 | −4.0% |
| 1891 | 1,236,056 | −5.3% |
| 1901 | 1,236,952 | +0.1% |
| 1911 | 1,250,531 | +1.1% |
| 1926 | 1,256,561 | +0.5% |
| 1951 | 1,370,921 | +9.1% |
| 1961 | 1,425,042 | +3.9% |
| 1971 | 1,536,065 | +7.8% |
| 1981 | 1,543,000 | +0.5% |
| 1991 | 1,607,300 | +4.2% |
| 2001 | 1,685,267 | +4.9% |
| 2011 | 1,810,863 | +7.5% |
| 2021 | 1,903,175 | +5.1% |
| Note: 1981 and 1991 data
[10]
Data for years prior to 1926 are from the Census of Ireland, for those counties that
became Northern Ireland in 1920. 2019 estimates [11] | ||
| Cities and towns by population [12] | ||||||
|---|---|---|---|---|---|---|
.JPG)
|
# | Settlement | Population | Metro
population |

| |
| 1 | Belfast | 334,420 | 671,559 | |||
| 2 | Derry | 84,750 | 237,000 | |||
| 3 | Lisburn [13] | 71,403 | ||||
| 4 | Greater Craigavon | 68,890 | ||||
| 5 | Newtownabbey [13] | 66,120 | ||||
| 6 | Bangor [13] | 62,650 | ||||
| 7 | Ballymena | 30,590 | ||||
| 8 | Newtownards | 28,860 | ||||
| 9 | Newry | 28,080 | ||||
| 10 | Carrickfergus [13] | 27,640 | ||||


Fertility
- Fertility statistics
-
 Percentage of births born outside of wedlock in Northern Ireland
 -
 Age of mother at birth in Northern Ireland


Place of birth

In 2001, 91.0% of the population were born in Northern Ireland, 7.2% were born in other parts of the UK and Ireland, and 1.8% were born elsewhere. By 2011, the proportion of immigrants from outside the UK and Ireland had risen to 4.3%, while the proportion born within them (outside Northern Ireland) had fallen to 6.7%. The highest number of non-British/Irish immigrants are in Belfast, followed by Craigavon Urban Area and Dungannon. Dungannon has a bigger share of immigrants than any town in Northern Ireland, while Strabane has the smallest share of these immigrants. [14]
| Place of Birth | 2001 [15] | 2011 [16] | 2021 [17] | |||
|---|---|---|---|---|---|---|
| Number | % | Number | % | Number | % | |
| Northern Ireland | 1,534,268 | 91.04 | 1,608,853 | 88.84 | 1,646,276 | 86.50% |
| England | 61,609 | 3.66 | 64,717 | 3.57 | 72,940 | 3.83% |
| Scotland | 16,772 | 1.00 | 15,455 | 0.85 | 16,521 | 0.87% |
| Wales | 3,008 | 0.18 | 2,552 | 0.14 | 2,796 | 0.15% |
| Republic of Ireland | 39,051 | 2.32 | 37,833 | 2.09 | 40,357 | 2.12% |
| Other European Union member countries | 10,355 | 0.61 | 67,451 | 3.54% | ||
| — Member countries prior to 2004 expansion | 9,703 | 0.54 | ||||
| — Accession countries 2004 onwards | 35,704 | 1.97 | ||||
| Other outside the EU | 20,204 | 1.20 | 36,046 | 1.99 | 57,012 | 2.99% |
| Europe | 3,689 | 0.19% | ||||
| Africa | 10,761 | 0.57% | ||||
| Middle East and Asia | 29,241 | 1.54% | ||||
| North, Central America and Caribbean | 8,207 | 0.43% | ||||
| South America | 1,858 | 0.10% | ||||
| Oceania and other | 3,076 | 0.16% | ||||
| Total | 1,685,267 | 100.00 | 1,810,863 | 100.00 | 1,903,173 | 100% |
Below are the 5 largest foreign-born groups in Northern Ireland according to 2014 ONS estimates. [18]
| Country of birth | Estimated population, 2013 | Estimated population, 2014 | Estimated population, 2015 |
|---|---|---|---|
| Poland | 25,000 | 20,000 | 18,000 |
| Lithuania | 7,000 | 8,000 | 13,000 |
| India | 8,000 | 6,000 | 6,000 |
| Philippines | 3,000 | 4,000 | 5,000 |
Ethnicity


The following table shows the ethnic group of respondents for the following censuses
| Ethnic group | 2001 [19] | 2011 [20] | 2021 [21] [22] | |||
|---|---|---|---|---|---|---|
| Number | % | Number | % | Number | % | |
| White: Total | 1,672,698 | 99.25% | 1,779,750 |
98.28% |
1,841,713 | 96.77% |
| White | 1,670,988 | 99.15% | 1,778,449 | 98.21% | – | – |
| White: British/Irish/Northern Irish only (national identity) and Christian/no religion/religion not stated (religion) | – | – | – | – | 1,749,970 | 91.9% |
| White: Other | – | – | – | – | 87,607 | 4.6% |
| White: Irish Traveller/White Gypsy | 1,710 | 0.10% | 1,301 | 0.07% | 2,609 | 0.14% |
| White: Roma | – | – | – | – | 1,529 | 0.08% |
| Asian or Asian British: Total | 6,824 | 0.40% | 19,130 | 1.06% | 30,667 | 1.61% |
| Asian/Asian British: Indian | 1,567 | 0.09% | 6,198 | 0.34% | 9,881 | 0.52% |
| Asian/Asian British: Pakistani | 668 | 0.04% | 1,091 | 0.06% | 1,596 | 0.08% |
| Asian/Asian British: Bangladeshi | 252 | 0.01% | 540 | 0.03% | – | – |
| Asian/Asian British: Chinese | 4,145 | 0.25% | 6,303 | 0.35% | 9,495 | 0.50% |
| Asian/Asian British: Filipino | 4,451 | 0.23% | ||||
| Asian/Asian British: Asian Other | 194 | 0.01% | 4,998 | 0.28% | 5,244 | 0.28% |
| Black or Black British: Total | 1,136 | 0.07% | 3,616 |
0.20% |
11,032 | 0.58% |
| Black or Black British: Caribbean | 255 | 0.02% | 372 | 0.02% | – | – |
| Black or Black British: African | 494 | 0.03% | 2,345 | 0.13% | 8,069 | 0.42% |
| Black or Black British: Other | 387 | 0.02% | 899 | 0.05% | 2,963 | 0.16% |
| Mixed: Total | 3,319 | 0.20% | 6,014 | 0.33% | 14,382 | 0.76% |
| Other: Any other ethnic group:Total | 1,290 | 0.08% | 2,353 |
0.13% |
5,385 | 0.29% |
| Other: Any other ethnic group | – | – | – | – | 3,568 | 0.19% |
| Other: Arab | – | – | – | – | 1,817 | 0.10% |
| Total | 1,685,267 | 100% | 1,810,863 | 100% | 1,903,179 | 100% |
- Population pyramids of ethnic groups within Northern Ireland in 2021
-
 White
White -
 White British and Irish
 -
 White Other
 -
 Ethnic minorities
 -
 Mixed
Mixed


Languages spoken
English is by far the most commonly spoken language in Northern Ireland. Two regional languages of Northern Ireland, Irish and Ulster Scots, are protected under the European Charter for Regional or Minority Languages. Several other languages are spoken by immigrants to Northern Ireland, the most common of which is Polish.
A question about knowledge of Irish was reintroduced to the census in 1991, for the first time since 1911. In 2011, the census question was modified to ask about Ulster Scots alongside Irish. [23]

Main language of all usual residents aged 3 and over
| Main language | 2011 [24] | 2021 [25] | ||
|---|---|---|---|---|
| Usual residents aged 3+ | Proportion | Usual residents aged 3+ | Proportion | |
| English | 1,681,171 | 96.86% | 1,751,510 | 95.37% |
| Polish | 17,731 | 1.02% | 20,134 | 1.10% |
| Lithuanian | 6,250 | 0.36% | 8,978 | 0.49% |
| Irish | 4,164 | 0.24% | 5,969 | 0.32% |
| Portuguese | 2,293 | 0.13% | 4,982 | 0.27% |
| Slovak | 2,257 | 0.13% | 2,333 | 0.13% |
| Chinese | 2,214 | 0.13% | 3,329 | 0.18% |
| Tagalog/Filipino | 1,895 | 0.11% | 1,339 | 0.07% |
| Latvian | 1,273 | 0.07% | 1,700 | 0.09% |
| Russian | 1,191 | 0.07% | 1,605 | 0.09% |
| Hungarian | 1,008 | 0.06% | 2,172 | 0.12% |
| Other | 13,090 | 0.75% | 28,293 | 1.5% |
| Total | 1,836,616 | 100% | ||

Ability in Irish of all usual residents aged 3 and over in the Census [26] [27]
| Ability in Irish | 2001 [28] | 2011 [29] | 2021 [25] | |||
|---|---|---|---|---|---|---|
| Usual residents aged 3+ | Proportion | Usual residents aged 3+ | Proportion | Usual residents aged 3+ | Proportion | |
| Understands spoken Irish, but cannot speak, read, or write | 36,479 | 2.25% | 70,501 | 4.06% | 90,801 | 4.94% |
| Can speak but cannot read or write Irish | 24,536 | 1.52% | 24,677 | 1.43% | 37,497 | 2.04% |
| Can speak and read but cannot write Irish | 7,183 | 0.44% | 7,414 | 0.43% | 9,683 | 0.53% |
| Can speak, read, write, and understand Irish | 75,125 | 4.64% | 64,847 | 3.74% | 71,872 | 3.91% |
| Other combination of skills | 24,167 | 1.49% | 17,459 | 1.01% | 18,764 | 1.02% |
| Has some knowledge of Irish | 167,490 | 10.35% | 184,898 | 10.65% | 228,617 | 12.45% |

Ability in Ulster Scots of all usual residents aged 3 and over in the Census [30]
| Ability in Ulster Scots | 2011 [31] | 2021 [25] | ||
|---|---|---|---|---|
| Usual residents aged 3+ | Proportion | Usual residents aged 3+ | Proportion | |
| Understands spoken Ulster Scots, but cannot speak, read, or write | 92,040 | 5.30% | 115,088 | 6.27% |
| Can speak but cannot read or write Ulster Scots | 10,265 | 0.59% | 26,570 | 1.45% |
| Can speak and read but cannot write Ulster Scots | 7,801 | 0.45% | 12,297 | 0.67% |
| Can speak, read, write, and understand Ulster Scots | 16,373 | 0.94% | 20,930 | 1.14% |
| Other combination of skills | 13,725 | 0.79% | 15,728 | 0.86% |
| Has some knowledge of Ulster Scots | 140,204 | 8.08% | 190,613 | 10.38% |
Religion
.png)


For the first century that Northern Ireland existed, the majority or plurality of its population identified with Protestantism, and with its founding, the region was intended to have a permanent Protestant majority. [32] With the 2021 census, Catholics outnumbered Protestants for the first time. The following table shows the religion stated by respondents to the 2001, 2011 and 2021 censuses.
| Religion stated | 2001 [33] | 2011 [34] | 2021 [35] | |||
|---|---|---|---|---|---|---|
| Number | % | Number | % | Number | % | |
| Roman Catholic | 678,462 | 40.2 | 738,033 | 40.8 | 805,151 | 42.3 |
| Presbyterian Church in Ireland | 348,742 | 20.7 | 345,101 | 19.1 | 316,103 | 16.6 |
| Church of Ireland | 257,788 | 15.3 | 248,821 | 13.7 | 219,788 | 11.5 |
| Methodist Church in Ireland | 59,173 | 3.5 | 54,253 | 3.0 | 44,728 | 2.4 |
| Other Christian | 102,221 | 6.1 | 104,380 | 5.8 | 130,377 | 6.9 |
| (Total non-Roman Catholic Christian) | 767,924 | 45.6 | 752,555 | 41.6 | 710,996 | 37.3 |
| (Total Christian) | 1,446,386 | 85.8 | 1,490,588 | 82.3 | 1,516,147 | 79.6 |
| Other religion | 5,028 | 0.3 | 14,859 | 0.8 | 25,519 | 1.3 |
| No religion | 183,164 | 10.1 | 330,983 | 17.4 | ||
| Religion not stated | 122,252 | 6.8 | 30,529 | 1.6 | ||
| (No religion and Religion not stated) | 233,853 | 13.9 | 305,416 | 16.9 | 361,512 | 19.0 |
| Total population | 1,685,267 | 100.0 | 1,810,863 | 100.0 | 1,903,175 | 100.0 |
The religious affiliations in the districts of Northern Ireland at the time of the 2011 census were as follows. Note that these boundaries changed in 2015.
| District | 2001 [36] | 2011 [37] | 2021 [38] | |||||||
|---|---|---|---|---|---|---|---|---|---|---|
| Catholic | Protestant and other Christian | Other or none | Catholic | Protestant and other Christian | Other or none | Catholic | Protestant and other Christian | No religion/not stated | Other | |
| Antrim | 35.2% | 47.2% | 17.6% | 37.5% | 43.2% | 19.2% | 38.1% | 39.0% | 21.6% | 1.3% |
| Ards | 10.4% | 68.7% | 20.9% | 10.9% | 65.4% | 23.6% | 10.9% | 58.8% | 29.2% | 1.1% |
| Armagh | 45.4% | 45.5% | 9.1% | 44.8% | 43.0% | 12.2% | 46.4% | 41.1% | 11.7% | 0.9% |
| Ballymena | 19.0% | 67.8% | 13.3% | 20.4% | 63.3% | 16.3% | 21.3% | 58.4% | 19.5% | 0.7% |
| Ballymoney | 29.5% | 59.1% | 11.3% | 29.6% | 56.7% | 13.6% | 30.0% | 53.8% | 15.5% | 0.6% |
| Banbridge | 28.6% | 58.7% | 12.7% | 29.4% | 55.3% | 15.3% | 31.0% | 49.4% | 18.6% | 0.9% |
| Belfast | 42.1% | 40.3% | 17.5% | 41.9% | 34.1% | 24.0% | 42.5% | 29.7% | 24.5% | 3.3% |
| Carrickfergus | 6.5% | 70.4% | 23.1% | 7.6% | 67.2% | 25.2% | 7.6% | 59.5% | 31.8% | 1.2% |
| Castlereagh | 15.8% | 64.9% | 19.3% | 19.5% | 57.3% | 23.2% | 21.8% | 48.4% | 28.2% | 1.7% |
| Coleraine | 24.1% | 60.5% | 15.4% | 25.0% | 56.8% | 18.2% | 25.3% | 52.5% | 21.2% | 1.0% |
| Cookstown | 55.2% | 38.0% | 6.8% | 55.1% | 34.0% | 11.0% | 58.2% | 31.8% | 9.6% | 0.4% |
| Craigavon | 41.7% | 46.7% | 11.6% | 42.1% | 42.1% | 15.8% | 43.4% | 37.7% | 17.5% | 1.4% |
| Derry | 70.9% | 20.8% | 8.4% | 67.4% | 19.4% | 13.1% | 70.3% | 18.0% | 10.6% | 1.0% |
| Down | 57.1% | 29.2% | 13.7% | 57.5% | 27.1% | 15.4% | 58.4% | 24.8% | 16.2% | 0.6% |
| Dungannon | 57.3% | 34.9% | 7.7% | 58.7% | 29.8% | 11.5% | 62.6% | 26.9% | 9.9% | 0.7% |
| Fermanagh | 55.5% | 36.1% | 8.4% | 54.9% | 34.3% | 10.8% | 55.8% | 32.1% | 11.2% | 0.9% |
| Larne | 22.2% | 61.9% | 15.9% | 21.8% | 59.7% | 18.5% | 21.3% | 54.7% | 23.3% | 0.7% |
| Limavady | 53.1% | 36.1% | 10.7% | 56.0% | 34.3% | 9.7% | 57.5% | 31.7% | 10.5% | 0.3% |
| Lisburn | 30.1% | 53.6% | 16.4% | 32.8% | 47.9% | 19.3% | 35.2% | 41.8% | 21.6% | 1.4% |
| Magherafelt | 61.5% | 32.0% | 6.5% | 62.4% | 28.3% | 9.3% | 65.0% | 26.2% | 8.1% | 0.7% |
| Moyle | 56.6% | 33.8% | 9.6% | 54.4% | 32.3% | 13.3% | 54.3% | 32.1% | 13.1% | 0.5% |
| Newry and Mourne | 75.9% | 16.4% | 7.7% | 72.1% | 15.2% | 12.7% | 75.1% | 14.9% | 9.3% | 0.7% |
| Newtownabbey | 17.1% | 64.5% | 18.4% | 19.9% | 57.8% | 22.3% | 22.1% | 51.0% | 25.6% | 1.4% |
| North Down | 10.0% | 64.5% | 25.5% | 11.2% | 60.3% | 28.5% | 11.6% | 52.2% | 34.9% | 1.4% |
| Omagh | 65.1% | 26.3% | 8.6% | 65.4% | 24.8% | 9.8% | 67.7% | 22.9% | 8.8% | 0.7% |
| Strabane | 63.1% | 30.9% | 6.0% | 60.1% | 30.7% | 9.2% | 63.0% | 29.5% | 7.0% | 0.5% |


Graphs are unavailable due to technical issues. There is more info on
Phabricator and on
MediaWiki.org. |
There was a high level of non-enumeration during the 1981 census, mainly due to protests in Catholic areas regarding the 1981 Irish hunger strike. [39]
National identity
This section needs to be updated. (September 2022) |


In Northern Ireland national identity is complex. Many in Northern Ireland have a British national identity and view the English, Scots and Welsh as fellow members of their common nation while regarding people from the Republic of Ireland as foreigners. Many others in Northern Ireland view people from the Republic of Ireland as being members of their common nation encompassing the island of Ireland and regard the English, Scots and Welsh as foreigners. Co-existing with this dichotomy is a Northern Irish identity, which can be held alone or, as is also the case with Englishness, Scottishness and Welshness, alongside a British identity, or alongside an Irish identity. A small number of people see themselves as being both British and Irish.
Although there is a strong correlation between religion and national identity, Catholics tending to identify as Irish and Protestants tending to identify as British, this is not an absolute relationship, and the correlation is much weaker amongst Catholics than it is amongst Protestants. Amongst Catholics, geography also plays an important role, with Catholics in heavily Protestant parts of Northern Ireland being more likely to call themselves British and less likely to call themselves Irish than Catholics in more Catholic areas of Northern Ireland. (The reverse is true for Protestants, but to a lesser extent.) In the 2011 census there were four of the twenty-six districts of Northern Ireland, all on the east coast, where more Catholics considered themselves British than considered themselves Irish.
While in the 2011 census Protestants outnumbered Catholics in only half of the districts in Northern Ireland, those who considered themselves British outnumbered those who considered themselves Irish in twenty of the twenty-six districts in Northern Ireland. This is partly because Catholics were more likely to see themselves as British than Protestants were to see themselves as Irish (13% vs. 4% respectively), but is also partly because those of no religion were substantially more likely to see themselves as British as see themselves as Irish. The irreligious tend to live in Protestant areas, suggesting that they are mostly of Protestant descent. Members of the immigrant population, which includes many Poles, are also more likely to consider themselves Catholic.
Northern Irish identity was almost equally held amongst Protestants as amongst Catholics, and it varied little according to geography.
In the 2021 census respondents gave their national identity as follows.
| National identity | Respondents |
|---|---|
| British only | 606,300(36.10%)
|
| Irish only | 554,400(33.01%)
|
| Northern Irish only | 376,400(22.41%)
|
| English, Scottish or Welsh | 29,000(1.73%)
|
| Other | 113,400(6.75%)
|

- Identity in Northern Ireland in 2021 by population pyramid
-
 British only identity
 -
 Irish only identity
 -
 Northern Irish only identity


Passports held

Those born in Northern Ireland have automatic British citizenship on the same basis and with the same provisos as those born elsewhere in the United Kingdom. As well as this, and despite the withdrawal of its constitutional claim to Northern Ireland in 1999, the Irish Government also grants the Entitlement to Irish citizenship to those born in Northern Ireland this is not automatic but a personal choice under Irish nationality law people in Northern Ireland have to choose this and are not born with automatic Irish citizenship. This means that most people in Northern Ireland are entitled to a British passport, an Irish passport, or both, as they so choose. By agreement between the Irish Government and Post Office Ltd, post offices in Northern Ireland provide a service whereby customers can apply for an Irish passport, operating alongside their service whereby customers can apply for a British passport. In the 2011 census, respondents stated that they held the following passports. [41] [42]
| Passport | All usual residents | Religion or religion brought up in | |||
|---|---|---|---|---|---|
| Catholic | Protestant and other Christian | Other Religions | None | ||
| No passport | 18.9% | 19.2% | 18.5% | 9.9% | 20.2% |
| EU/EEA Countries | 82.1% | 82.4% | 82.4% | 69.3% | 78.4% |
| United Kingdom | 59.1% | 38.4% | 77.8% | 56.0% | 65.2% |
| Ireland | 20.8% | 40.5% | 4.1% | 10.0% | 7.2% |
| Poland | 1.0% | 2.0% | 0.1% | 0.6% | 0.9% |
| Lithuania | 0.4% | 0.7% | 0.0% | 0.2% | 0.8% |
| Other EU/EEA | 0.8% | 0.9% | 0.4% | 2.4% | 4.2% |
| Other | 1.2% | 0.9% | 0.7% | 26.0% | 3.5% |
| Passport | All usual residents | Religion or religion brought up in | |||
|---|---|---|---|---|---|
| Catholic | Protestant and other Christian | Other Religions | None | ||
| No passport | 18.9% | 19.2% | 18.5% | 9.9% | 20.2% |
| United Kingdom only | 57.2% | 36.1% | 76.3% | 51.6% | 63.3% |
| Ireland only | 18.9% | 38.1% | 2.7% | 7.4% | 5.9% |
| United Kingdom and Ireland only | 1.7% | 2.1% | 1.3% | 1.8% | 1.1% |
| United Kingdom and other (not Ireland) | 0.2% | 0.1% | 0.2% | 2.4% | 0.7% |
| Ireland and other (not United Kingdom) | 0.1% | 0.2% | 0.0% | 0.6% | 0.2% |
| EU/EEA (not United Kingdom or Ireland) | 2.2% | 3.5% | 0.4% | 3.1% | 5.9% |
| Other | 0.8% | 0.6% | 0.4% | 23.0% | 2.7% |
Age

According to the Northern Ireland Statistics and Research Authority the average (median) age increased from 34 years to 37 years between the 2001 and 2011 censuses. Over the same period, the share of the population represented by children aged under 16 years fell from 24 per cent to 21 per cent, while the proportion of people aged 65 years and over rose from 13 per cent to 15 per cent. [43]
- Population pyramids of each of Northern Ireland's Local Government Districts
-
 Ards and North Down
 -
 Armagh City, Banbridge and Craigavon
 -
 Antrim and Newtownabbey
 -
 Belfast
 -
 Causeway Coast and Glens
 -
 Derry City and Strabane
 -
 Fermanagh and Omagh
 -
 Mid and East Antrim
 -
 Mid Ulster
 -
 Newry, Mourne and Down
 -
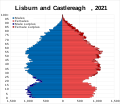 Lisburn and Castlereagh


Vital statistics since 1900
| Average population [44] [45] [46] [47] | Live births | Deaths | Natural change | Crude birth rate (per 1000) | Crude death rate (per 1000) | Natural change (per 1000) | Total fertility rate | |
|---|---|---|---|---|---|---|---|---|
| 1901 | 30,782 | 23,954 | 6,828 | |||||
| 1902 | 30,707 | 23,171 | 7,536 | |||||
| 1903 | 31,290 | 23,096 | 8,194 | |||||
| 1904 | 31,550 | 23,536 | 8,014 | |||||
| 1905 | 31,405 | 22,949 | 8,456 | |||||
| 1906 | 31,389 | 23,039 | 8,350 | |||||
| 1907 | 30,969 | 23,754 | 7,215 | |||||
| 1908 | 30,600 | 23,133 | 7,467 | |||||
| 1909 | 30,640 | 22,275 | 8,365 | |||||
| 1910 | 1,246,000 | 30,219 | 22,576 | 7,643 | 24.3 | 18.1 | 6.1 | |
| 1911 | 1,249,000 | 30,407 | 21,326 | 9,081 | 24.3 | 17.1 | 7.3 | |
| 1912 | 1,248,000 | 30,301 | 21,698 | 8,603 | 24.3 | 17.4 | 6.9 | |
| 1913 | 1,243,000 | 29,880 | 22,510 | 7,370 | 24.0 | 18.1 | 5.9 | |
| 1914 | 1,242,000 | 29,704 | 21,671 | 8,033 | 23.9 | 17.4 | 6.5 | |
| 1915 | 1,210,000 | 28,082 | 22,438 | 5,644 | 23.2 | 18.5 | 4.7 | |
| 1916 | 1,205,000 | 26,623 | 20,764 | 5,859 | 22.1 | 17.2 | 4.9 | |
| 1917 | 1,208,000 | 24,949 | 21,011 | 3,938 | 20.7 | 17.4 | 3.3 | |
| 1918 | 1,214,000 | 26,212 | 25,013 | 1,199 | 21.6 | 20.6 | 1.0 | |
| 1919 | 1,250,000 | 27,496 | 22,836 | 4,660 | 22.0 | 18.2 | 3.8 | |
| 1920 | 1,258,000 | 32,521 | 21,017 | 11,504 | 25.8 | 16.7 | 9.1 | |
| 1921 | 1,264,000 | 29,710 | 19,301 | 10,409 | 23.7 | 15.4 | 8.3 | |
| 1922 | 1,269,000 | 29,531 | 19,795 | 9,736 | 23.2 | 15.6 | 7.6 | |
| 1923 | 1,259,000 | 30,097 | 18,790 | 11,307 | 23.9 | 14.9 | 9.1 | |
| 1924 | 1,258,000 | 28,496 | 20,299 | 8,197 | 22.7 | 16.1 | 6.5 | |
| 1925 | 1,257,000 | 27,686 | 19,784 | 7,902 | 22.0 | 15.8 | 6.3 | |
| 1926 | 1,254,000 | 28,162 | 18,827 | 9,335 | 22.5 | 15.1 | 7.4 | |
| 1927 | 1,250,000 | 26,676 | 18,216 | 8,460 | 21.4 | 14.6 | 6.8 | |
| 1928 | 1,247,000 | 25,963 | 18,004 | 7,959 | 20.9 | 14.4 | 6.4 | |
| 1929 | 1,240,000 | 25,410 | 19,822 | 5,588 | 20.5 | 16.0 | 4.4 | |
| 1930 | 1,237,000 | 25,879 | 17,148 | 8,731 | 20.9 | 13.9 | 7.0 | |
| 1931 | 1,243,000 | 25,673 | 18,049 | 7,624 | 20.7 | 14.5 | 6.2 | |
| 1932 | 1,251,000 | 25,107 | 17,812 | 7,295 | 20.1 | 14.2 | 5.8 | |
| 1933 | 1,258,000 | 24,601 | 18,154 | 6,447 | 19.6 | 14.5 | 5.1 | |
| 1934 | 1,265,000 | 25,365 | 17,521 | 7,844 | 20.1 | 13.9 | 6.2 | |
| 1935 | 1,271,000 | 24,742 | 18,592 | 6,150 | 19.5 | 14.6 | 4.8 | |
| 1936 | 1,276,000 | 25,909 | 18,429 | 7,480 | 20.3 | 14.4 | 5.9 | |
| 1937 | 1,281,000 | 25,412 | 19,282 | 6,130 | 19.8 | 15.1 | 4.8 | |
| 1938 | 1,286,000 | 25,742 | 17,649 | 8,093 | 20.0 | 13.7 | 6.3 | |
| 1939 | 1,295,000 | 25,240 | 17,542 | 7,698 | 19.5 | 13.5 | 5.9 | |
| 1940 | 1,299,000 | 25,363 | 18,941 | 6,422 | 19.5 | 14.6 | 4.9 | |
| 1941 | 1,308,000 | 26,887 | 20,034 | 6,853 | 20.6 | 15.3 | 5.2 | |
| 1942 | 1,329,000 | 29,645 | 17,570 | 12,075 | 22.3 | 13.2 | 9.1 | |
| 1943 | 1,341,000 | 31,521 | 17,720 | 13,801 | 23.5 | 13.2 | 10.3 | |
| 1944 | 1,357,000 | 30,900 | 16,980 | 13,920 | 22.8 | 12.5 | 10.3 | |
| 1945 | 1,359,000 | 29,007 | 16,432 | 12,575 | 21.3 | 12.1 | 9.3 | |
| 1946 | 1,350,000 | 30,134 | 16,706 | 13,428 | 22.3 | 12.4 | 9.9 | |
| 1947 | 1,350,000 | 31,254 | 16,944 | 14,310 | 23.2 | 12.6 | 10.6 | |
| 1948 | 1,362,000 | 29,532 | 15,145 | 14,387 | 21.7 | 11.1 | 10.6 | |
| 1949 | 1,371,000 | 29,106 | 15,670 | 13,436 | 21.2 | 11.4 | 9.8 | |
| 1950 | 1,377,000 | 28,794 | 15,839 | 12,955 | 20.9 | 11.5 | 9.4 | |
| 1951 | 1,373,000 | 28,477 | 17,628 | 10,849 | 20.7 | 12.8 | 7.9 | |
| 1952 | 1,375,000 | 28,760 | 14,812 | 13,948 | 20.9 | 10.8 | 10.1 | |
| 1953 | 1,384,000 | 28,984 | 14,813 | 14,171 | 20.9 | 10.7 | 10.2 | |
| 1954 | 1,387,000 | 28,803 | 15,124 | 13,679 | 20.8 | 10.9 | 9.9 | |
| 1955 | 1,394,000 | 28,965 | 15,407 | 13,558 | 20.8 | 11.1 | 9.7 | |
| 1956 | 1,397,000 | 29,489 | 14,858 | 14,631 | 21.1 | 10.6 | 10.5 | |
| 1957 | 1,399,000 | 30,108 | 15,187 | 14,921 | 21.5 | 10.9 | 10.7 | |
| 1958 | 1,402,000 | 30,301 | 15,132 | 15,169 | 21.6 | 10.8 | 10.8 | |
| 1959 | 1,408,000 | 30,809 | 15,403 | 15,406 | 21.9 | 10.9 | 10.9 | |
| 1960 | 1,420,000 | 31,989 | 15,296 | 16,693 | 22.5 | 10.8 | 11.8 | |
| 1961 | 1,427,000 | 31,915 | 16,108 | 15,807 | 22.4 | 11.3 | 11.1 | |
| 1962 | 1,435,000 | 32,565 | 15,226 | 17,339 | 22.7 | 10.6 | 12.1 | |
| 1963 | 1,446,000 | 33,414 | 15,899 | 17,515 | 23.1 | 11.0 | 12.1 | |
| 1964 | 1,458,000 | 34,345 | 15,354 | 18,991 | 23.6 | 10.5 | 13.0 | |
| 1965 | 1,469,000 | 33,890 | 15,551 | 18,339 | 23.1 | 10.6 | 12.5 | |
| 1966 | 1,478,000 | 33,228 | 16,441 | 16,787 | 22.5 | 11.1 | 11.4 | |
| 1967 | 1,491,000 | 33,415 | 14,671 | 18,744 | 22.4 | 9.8 | 12.6 | |
| 1968 | 1,502,000 | 33,173 | 15,933 | 17,240 | 22.1 | 10.6 | 11.5 | |
| 1969 | 1,513,000 | 32,428 | 16,338 | 16,090 | 21.4 | 10.8 | 10.6 | |
| 1970 | 1,525,000 | 32,086 | 16,551 | 15,535 | 21.0 | 10.9 | 10.2 | |
| 1971 | 1,540,000 | 31,765 | 16,202 | 15,563 | 20.6 | 10.5 | 10.1 | |
| 1972 | 1,539,000 | 29,994 | 17,032 | 12,962 | 19.5 | 11.1 | 8.4 | |
| 1973 | 1,530,000 | 29,200 | 17,669 | 11,531 | 19.1 | 11.5 | 7.5 | |
| 1974 | 1,527,000 | 27,160 | 17,327 | 9,833 | 17.8 | 11.3 | 6.4 | |
| 1975 | 1,524,000 | 26,130 | 16,511 | 9,619 | 17.2 | 10.8 | 6.4 | |
| 1976 | 1,524,000 | 26,361 | 17,030 | 9,331 | 17.3 | 11.2 | 6.1 | |
| 1977 | 1,523,000 | 25,437 | 16,921 | 8,516 | 16.7 | 11.1 | 5.6 | |
| 1978 | 1,523,000 | 26,239 | 16,153 | 10,086 | 17.2 | 10.6 | 6.6 | |
| 1979 | 1,528,000 | 28,178 | 16,811 | 11,367 | 18.4 | 11.0 | 7.4 | |
| 1980 | 1,533,000 | 28,582 | 16,835 | 11,747 | 18.6 | 11.0 | 7.7 | |
| 1981 | 1,543,000 | 27,166 | 16,256 | 10,910 | 17.6 | 10.5 | 7.1 | 2.79 |
| 1982 | 1,545,000 | 26,872 | 15,918 | 10,954 | 17.4 | 10.3 | 7.1 | 2.59 |
| 1983 | 1,551,000 | 27,026 | 16,039 | 10,987 | 17.4 | 10.3 | 7.1 | 2.53 |
| 1984 | 1,557,000 | 27,477 | 15,692 | 11,785 | 17.6 | 10.1 | 7.5 | 2.51 |
| 1985 | 1,565,000 | 27,427 | 15,955 | 11,472 | 17.5 | 10.2 | 7.3 | 2.50 |
| 1986 | 1,574,000 | 27,975 | 16,065 | 11,910 | 17.8 | 10.2 | 7.6 | 2.45 |
| 1987 | 1,582,000 | 27,653 | 15,334 | 12,319 | 17.5 | 9.7 | 7.8 | 2.44 |
| 1988 | 1,585,000 | 27,514 | 15,813 | 11,701 | 17.4 | 10.0 | 7.4 | 2.39 |
| 1989 | 1,590,000 | 25,831 | 15,844 | 9,987 | 16.2 | 10.0 | 6.2 | 2.35 |
| 1990 | 1,596,000 | 26,251 | 15,426 | 10,825 | 16.5 | 9.7 | 6.8 | 2.19 |
| 1991 | 1,607,000 | 26,028 | 15,096 | 10,932 | 16.2 | 9.4 | 6.9 | 2.21 |
| 1992 | 1,623,000 | 25,354 | 14,988 | 10,366 | 15.6 | 9.2 | 6.4 | 2.16 |
| 1993 | 1,636,000 | 24,722 | 15,633 | 9,089 | 15.1 | 9.6 | 5.5 | 2.08 |
| 1994 | 1,644,000 | 24,098 | 15,114 | 8,984 | 14.7 | 9.2 | 5.5 | 2.01 |
| 1995 | 1,649,000 | 23,693 | 15,310 | 8,383 | 14.4 | 9.3 | 5.1 | 1.95 |
| 1996 | 1,662,000 | 24,382 | 15,218 | 9,164 | 14.7 | 9.2 | 5.5 | 1.91 |
| 1997 | 1,671,000 | 24,087 | 14,971 | 9,116 | 14.4 | 9.0 | 5.4 | 1.95 |
| 1998 | 1,678,000 | 23,668 | 14,993 | 8,675 | 14.1 | 8.9 | 5.2 | 1.93 |
| 1999 | 1,679,000 | 22,957 | 15,663 | 7,294 | 13.7 | 9.3 | 4.3 | 1.90 |
| 2000 | 1,683,000 | 21,512 | 14,903 | 6,609 | 12.8 | 8.9 | 3.9 | 1.86 |
| 2001 | 1,689,000 | 21,962 | 14,513 | 7,449 | 13.0 | 8.6 | 4.4 | 1.75 |
| 2002 | 1,697,000 | 21,385 | 14,586 | 6,799 | 12.6 | 8.6 | 4.0 | 1.81 |
| 2003 | 1,703,000 | 21,648 | 14,462 | 7,186 | 12.7 | 8.5 | 4.2 | 1.76 |
| 2004 | 1,710,000 | 22,318 | 14,354 | 7,964 | 13.0 | 8.4 | 4.7 | 1.79 |
| 2005 | 1,724,000 | 22,328 | 14,224 | 8,104 | 12.9 | 8.2 | 4.7 | 1.84 |
| 2006 | 1,742,000 | 23,272 | 14,532 | 8,740 | 13.4 | 8.3 | 5.0 | 1.84 |
| 2007 | 1,759,000 | 24,451 | 14,649 | 9,802 | 13.9 | 8.3 | 5.6 | 1.90 |
| 2008 | 1,775,000 | 25,631 | 14,907 | 10,724 | 14.4 | 8.4 | 6.0 | 1.98 |
| 2009 | 1,789,000 | 24,910 | 14,413 | 10,497 | 13.9 | 8.1 | 5.8 | 2.05 |
| 2010 | 1,799,000 | 25,315 | 14,457 | 10,858 | 14.1 | 8.0 | 6.1 | 2.02 |
| 2011 | 1,809,000 | 25,273 | 14,204 | 11,069 | 14.0 | 7.8 | 6.2 | 2.02 |
| 2012 | 1,820,000 | 25,269 | 14,756 | 10,513 | 14.0 | 8.1 | 5.9 | 2.03 |
| 2013 | 1,830,000 | 24,277 | 14,968 | 9,309 | 13.3 | 8.2 | 5.1 | 1.95 |
| 2014 | 1,840,000 | 24,394 | 14,678 | 9,716 | 13.3 | 8.0 | 5.3 | 1.96 |
| 2015 | 1,851,000 | 24,215 | 15,553 | 8,662 | 13.1 | 8.4 | 4.7 | 1.94 |
| 2016 | 1,862,000 | 24,076 | 15,430 | 8,646 | 12.9 | 8.3 | 4.6 | 1.93 |
| 2017 | 1,871,000 | 23,075 | 16,036 | 7,039 | 12.3 | 8.6 | 3.7 | 1.85 |
| 2018 | 1,882,000 | 22,829 | 15,923 | 6,906 | 12.1 | 8.5 | 3.6 | 1.83 |
| 2019 | 1,893,700 | 22,447 | 15,758 | 6,689 | 11.9 | 8.3 | 3.6 | 1.80 |
| 2020 | 1,896,000 | 20,815 | 17,614 | 3,201 | 11.0 | 9.3 | 1.7 | 1.68 |
| 2021 | 1,903,175 | 22,071 | 17,558 | 4,513 | 11.6 | 9.2 | 2.4 | 1.79 |
| 2022 | 1,910,500 | 20,837 | 17,159 | 3,678 | 10.9 | 9.0 | 1.9 | 1.71 |
| 2023 | 19,977 | 17,254 | 2,723 |
Current vital statistics
| Period | Live births | Deaths | Natural increase |
|---|---|---|---|
| January - March 2023 | 5,301 | 4,799 | +502 |
| January - March 2024 | 5,077 | 5,059 | +18 |
| Difference |
See also
- Demographics of the Republic of Ireland
- Demographics of the United Kingdom
- Politics of Northern Ireland
References
- ^ Anderson, James; Shuttleworth, Ian (1998). "Sectarian demography, territoriality and political development in Northern Ireland". Political Geography. 17 (2): 187–208. doi: 10.1016/S0962-6298(97)00035-8. ISSN 0962-6298. PMID 12348611.
- ^ Specia, Megan; O’Loughlin, Ed (22 September 2022). "Catholics Outnumber Protestants in Northern Ireland for the First Time". The New York Times.
- ^ a b Cooley, Laurence (30 August 2021). "Census politics in Northern Ireland from the Good Friday Agreement to Brexit: Beyond the 'sectarian headcount'?". The British Journal of Politics and International Relations. 23 (3): 451–470. doi: 10.1177/1369148120959045. S2CID 228856031.
- ^ "More Catholics than Protestants in Northern Ireland for first time, census finds". The Irish Times.
- ^ "Communal counting: The Northern Ireland census". 6 March 2019.
- ^ "Census 2021: More from Catholic background in NI than Protestant". BBC News. 22 September 2022.
- ^ Pepper, Diarmuid. "'Historic' shift for Northern Ireland but what do the Census findings tell us about its future?". TheJournal.ie.
-
^
"Why drawing political claims from NI census is problematic". 26 September 2022 – via www.rte.ie.
{{
cite journal}}
: Cite journal requires|journal=( help) - ^ Coulter, Colin; Flaherty, Eoin; Shirlow, Peter (20 September 2023). "'Seismic' or stalemate? The (bio)politics of the 2021 Northern Ireland Census". Space and Polity. doi: 10.1080/13562576.2023.2260153.
- ^ "NISRA: Historic Population Trends" (PDF). Archived from the original (PDF) on 10 October 2013. Retrieved 22 July 2014.
- ^ "NISRA: Population Clock". Retrieved 7 March 2019.
- ^ "Statistical Classification and Delineation of Settlements" (PDF). Northern Ireland Statistics and Research Agency. February 2005. Archived from the original (PDF) on 1 April 2014.
- ^ a b c d Part of Belfast metropolitan area
- ^ "NI migrant population triples in decade, says study". BBC News. 26 June 2014.
- ^ "Northern Ireland Neighbourhood Information Service" (XLS). Ninis2.nisra.gov.uk. Retrieved 22 July 2014.
- ^ "Northern Ireland Neighbourhood Information Service". Archived from the original on 4 March 2016. Retrieved 22 July 2014.
- ^ "Census 2021 main statistics demography tables – country of birth". Northern Ireland Statistics and Research Agency. 7 September 2022. Retrieved 23 September 2022.
- ^ "Table 1.3: Overseas-born population in the United Kingdom, excluding some residents in communal establishments, by sex, by country of birth, January 2014 to December 2014". Office for National Statistics. 27 August 2015. Retrieved 17 April 2016. Figures given are the central estimates. See the source for 95 per cent confidence intervals.
- ^ "Northern Ireland Neighbourhood Information Service". Retrieved 22 July 2014.
- ^ "Northern Ireland Neighbourhood Information Service". Retrieved 22 July 2014.
- ^ "Census 2021 main statistics ethnicity tables". Northern Ireland Statistics and Research Agency. 7 September 2022. Retrieved 23 September 2022.
- ^ "Racial Equality (The Executive Office)". build.nisra.gov.uk. Retrieved 25 June 2023.
- ^ Cooley, Laurence (24 March 2022). ""It will do no more than annoy the protestants": the 1991 Northern Ireland census and the Irish language". Nationalism and Ethnic Politics. 28 (3): 269–289. doi: 10.1080/13537113.2022.2052594. eISSN 1557-2986. ISSN 1353-7113. S2CID 247723794.
- ^ "Northern Ireland Neighbourhood Information Service". Retrieved 22 July 2014.
- ^ a b c "Census 2021 main statistics language tables". Northern Ireland Statistics and Research Agency. 7 September 2022. Retrieved 23 September 2022.
- ^ "Northern Ireland Neighbourhood Information Service". Retrieved 22 July 2014.
- ^ "Northern Ireland Neighbourhood Information Service". Archived from the original on 1 April 2014. Retrieved 22 July 2014.
- ^ "2001 Northern Irish Census" (PDF). Northern Ireland Statistics and Research Agency. Retrieved 19 October 2022.
- ^ "2011 Northern Irish Census" (PDF). Northern Ireland Statistics and Research Agency. Retrieved 19 October 2022.
- ^ "Northern Ireland Neighbourhood Information Service". Retrieved 22 July 2014.
- ^ "2011 Census - Key Statistics for Northern Ireland - Report" (PDF). Northern Ireland Statistics and Research Agency. 11 December 2012. Retrieved 20 October 2022.
- ^ Carroll, Rory (22 September 2022). "Catholics outnumber Protestants in Northern Ireland for first time". The Guardian. Retrieved 23 September 2022.
- ^ "Northern Ireland Neighbourhood Information Service". Retrieved 22 July 2014.
- ^ "Northern Ireland Neighbourhood Information Service". Retrieved 22 July 2014.
- ^ "Census 2021 main statistics religion tables". Northern Ireland Statistics and Research Agency. 7 September 2022. Retrieved 23 September 2022.
- ^ "Northern Ireland Neighbourhood Information Service". Retrieved 22 July 2014.
- ^ "Northern Ireland Neighbourhood Information Service". Retrieved 22 July 2014.
- ^ "Religion - 4 Categories". build.nisra.gov.uk. Retrieved 25 June 2023.
- ^ "CAIN Web Service". Retrieved 21 April 2022.
- ^ "Northern Ireland Census Data". explore.nisra.gov.uk. Retrieved 22 September 2022.
- ^ "Northern Ireland Neighbourhood Information Service". Retrieved 22 July 2014.
- ^ "Northern Ireland Neighbourhood Information Service". Retrieved 22 July 2014.
- ^ Census 2011: Key Statistics for Northern Ireland Statistics Bulletin December 2012, Accessed 22 December 2012
- ^ B.R. Mitchell. European historical statistics, 1750–1975
- ^ "United Nations. Demographic Yearbook 1948" (PDF). Unstats.un.org. Retrieved 3 October 2017.
- ^ "Northern Ireland Statistics & Research Agency". Nisra.gov.uk. Archived from the original on 29 August 2012. Retrieved 3 October 2017.
- ^ "Population and vital events, 1926-2014" (PDF). Nisra.gov.uk. Archived from the original (PDF) on 4 March 2016. Retrieved 3 October 2017.
- ^ "Births". NISRA. 30 March 2017. Retrieved 12 February 2024.
- ^ "Deaths". NISRA. 12 January 2017. Retrieved 12 February 2024.
Further reading
- Kaufmann, Eric (2011). "Demographic Change and Conflict in Northern Ireland: Reconciling Qualitative and Quantitative Evidence" (PDF). Ethnopolitics. 10 (3–4): 369–389. doi: 10.1080/17449057.2011.596117. ISSN 1744-9057. S2CID 10882870.