-
 White
White -
 White-British
 -
 White-Irish
 -
 White-Other
 -
 Asian
Asian -
 Asian-Indian
 -
 Asian-Pakistani
 -
 Asian-Bangladeshi
 -
 Asian-Chinese
 -
 Black
Black -
 Black-African
 -
 Black-Caribbean
 -
 Other-Arab
(Redirected from
Demography of Luton)
| Demographics of Luton | |
|---|---|
 Population pyramid of Luton | |
| Population | 225,261 (2021) |
| Density | 4,696/km2 (12,160/sq mi) (2011) |

Luton, Bedfordshire, England is an ethnically and culturally diverse town of 203,201 people. [1] It's primarily urban, with a population density of 4,696/km2 (12,160/sq mi). Luton has seen several waves of immigration. In the early part of the 20th century, there was internal migration of Irish and Scottish people to the town. These were followed by Afro-Caribbean and Asian immigrants. More recently immigrants from other European Union countries have made Luton their home. As a result of this Luton has a diverse ethnic mix, with a significant population of Asian descent, mainly Pakistani 29,353 (14.4%) and Bangladeshi 13,606 (6.7%).
Since the 2011 census, Luton has had a white British population less than 50%, one of three towns in the United Kingdom along with Leicester and Slough. Luton has a majority white population, when non-British white people such as the Irish and Eastern Europeans are included. [2] Identity wise, 81% of the population of Luton define themselves as British of any race. [3]

Ethnicity


The following table shows the ethnic group of respondents for estimations for 1971 and in the 1991 to 2021 censuses in Luton.
Luton is a majority minority town in which no single ethnic group make up the majority of residents, however by broad multi-ethnic groups, Whites make up 54.7% of the population, a decline of 25.5% from 1991 when Whites made up 4 out of every 5 residents (80.2%). Asian British people have grown in proportional size, having gone from 14% in 1991 to nearly one third of the town's population (30%) in 2011. Black British residents have also increased from nearly 5% to nearly 10% in two decades as well as Mixed residents who have gone from 2.6% in 2001 to 4.1% in 2011.
| Ethnic Group | 1971 estimations [4] | 1981 estimations [5] | 1991 [6] | 2001 [7] | 2011 [8] | 2021 [9] | ||||||
|---|---|---|---|---|---|---|---|---|---|---|---|---|
| Number | % | Number | % | Number | % | Number | % | Number | % | Number | % | |
| White: Total | 148,061 | 93.3% | 139,705 | 86.1% | 137,665 | 80.19% | 132,566 | 71.90% | 111,079 | 54.66% | 101,798 | 45.2% |
| White: British | – | – | – | – | – | – | 119,793 | 64.97% | 90,530 | 44.55% | 71,532 | 31.8% |
| White: Irish | – | – | – | – | 9,266 | 5.4% | 8,569 | 4.65% | 6,126 | 3.01% | 4,570 | 2.0% |
| White: Gypsy or Irish Traveller [note 1] | – | – | – | – | – | – | – | – | 198 | 0.10% | 238 | 0.1% |
| White: Roma | – | – | – | – | – | – | – | – | – | – | 808 | 0.4% |
| White: Other | – | – | – | – | – | – | 4,204 | 2.28% | 14,225 | 7.00% | 24,650 | 10.9% |
| Asian or Asian British: Total | – | – | – | – | 24,114 | 14.04% | 34,773 | 18.86% | 60,952 | 30% | 83,325 | 37.1% |
| Asian or Asian British: Indian | – | – | – | – | 7,205 | 7,538 | 4.09% | 10,625 | 5.23% | 12,096 | 5.4% | |
| Asian or Asian British: Pakistani | – | – | – | – | 10,657 | 17,012 | 9.23% | 29,353 | 14.45% | 41,143 | 18.3% | |
| Asian or Asian British: Bangladeshi | – | – | – | – | 4,679 | 7,641 | 4.14% | 13,606 | 6.70% | 20,630 | 9.2% | |
| Asian or Asian British: Chinese [note 2] | – | – | – | – | 655 | 1,096 | 0.59% | 1,497 | 0.74% | 901 | 0.4% | |
| Asian or Asian British: Other Asian | – | – | – | – | 918 | 1,486 | 0.81% | 5,871 | 2.89% | 8,555 | 3.8% | |
| Black or Black British: Total | – | – | – | – | 8,307 | 4.83% | 11,684 | 6.34% | 19,909 | 9.80% | 22,735 | 10% |
| Black or Black British: African | – | – | – | – | 608 | 3,204 | 1.74% | 9,169 | 4.51% | 11,774 | 5.2% | |
| Black or Black British: Caribbean | – | – | – | – | 6,238 | 7,653 | 4.15% | 8,177 | 4.02% | 8,216 | 3.6% | |
| Black or Black British: Other Black | – | – | – | – | 1,461 | 827 | 0.45% | 2,563 | 1.26% | 2,745 | 1.2% | |
| Mixed: Total | – | – | – | – | – | – | 4,728 | 2.56% | 8,281 | 4.08% | 9,620 | 4.3% |
| Mixed: White and Black Caribbean | – | – | – | – | – | – | 2,414 | 1.31% | 3,831 | 1.89% | 3,486 | 1.5% |
| Mixed: White and Black African | – | – | – | – | – | – | 389 | 0.21% | 915 | 0.45% | 1,268 | 0.6% |
| Mixed: White and Asian | – | – | – | – | – | – | 1,058 | 0.57% | 1,805 | 0.89% | 2,429 | 1.1% |
| Mixed: Other Mixed | – | – | – | – | – | – | 867 | 0.47% | 1,730 | 0.85% | 2,437 | 1.1% |
| Other: Total | – | – | – | – | 1,585 | 0.92% | 620 | 0.34% | 2,980 | 1.47% | 7,783 | 3.4% |
| Other: Arab [note 3] | – | – | – | – | – | – | – | – | 1,646 | 0.81% | 2,106 | 0.9% |
| Other: Any other ethnic group | – | – | – | – | 1,585 | 0.92% | 620 | 0.34% | 1,334 | 0.66% | 5,677 | 2.5% |
| Ethnic minority: Total | 10,694 | 6.7% | 22,626 | 13.9% | 34,006 | 19.8% | 51,805 | 28.1% | 92,122 | 45.3% | 123,463 | 54.8% |
| Total | 158,755 | 100% | 162,331 | 100% | 171,671 | 100% | 184,371 | 100% | 203,201 | 100% | 225,261 | 100% |
Notes
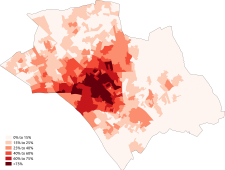
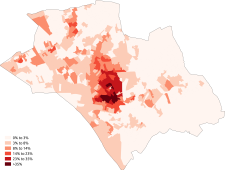
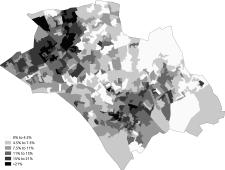
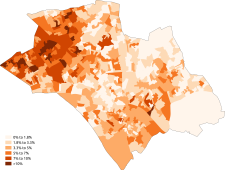
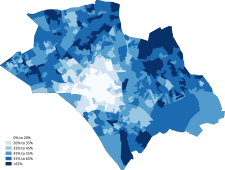
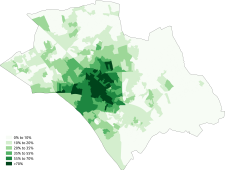
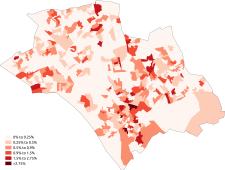
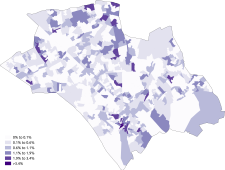
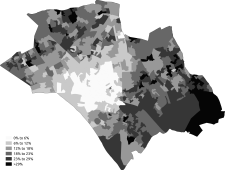
Distribution
Distribution of ethnic groups according to the 2011 census in Luton


Ethnicity of school pupils
Luton's schools are majority-minority, that being no single ethnic group makes up the majority, the single largest group is British Pakistanis at 25.1% of the school pupil population and the largest multi-ethnic group being Asian British people at 47.4% in 2022, which was previous White's at 53.5% in 2004. The native White British population has declined from a near majority in 2004 at 49.5% to 17.2% in 2022. Black British people and Mixed people have also increased however Other ethnicities has declined from a peak of 3.7% in 2016 to 2.2% in 2022.
| Ethnic group | School year [10] [11] | |||||
|---|---|---|---|---|---|---|
| 2004 | 2015/16 | 2021/2022 | ||||
| Number | % | Number | % | Number | % | |
| White: Total | 14,900 | 53.5% | 7,285 | 29.4% | 12,230 | 30.2% |
| White: British | 13,780 | 49.5% | 4,229 | 17.1% | 6,972 | 17.2% |
| White: Irish | 550 | 112 | 154 | |||
| White: Traveller of Irish heritage | 40 | 34 | 44 | |||
| White: Gypsy/Roma | 20 | 151 | 169 | |||
| White: Other | 510 | 2,759 | 4,891 | |||
| Asian / Asian British: Total | 8,140 | 29.3% | 12,089 | 48.8% | 19,185 | 47.4% |
| Asian / Asian British: Indian | 950 | 3.4% | 888 | 3.6% | 1,571 | 3.9% |
| Asian / Asian British: Pakistani | 4,090 | 14.7% | 6,177 | 24.9% | 10,163 | 25.1% |
| Asian / Asian British: Bangladeshi | 2,080 | 149 | 4,998 | |||
| Asian / Asian British: Chinese | 90 | 46 | 87 | |||
| Asian / Asian British: Other Asians | 930 | 1,235 | 2,366 | |||
| Black / Black British: Total | 2,510 | 9% | 2,140 | 8.6% | 3,995 | 9.9% |
| Black: Caribbean | 1,320 | 327 | 1,013 | |||
| Black: African | 950 | 1,653 | 2,613 | |||
| Black: Other Blacks | 250 | 160 | 369 | |||
| Mixed / British Mixed | 1,750 | 6.3% | 2,105 | 8.5% | 3,676 | 9.1% |
| Other: Total | 170 | 0.6% | 909 | 3.7% | 890 | 2.2% |
| Unclassified | 390 | 266 | 475 | |||
| Total: | 27,840 | 100% | 24,794 | 100% | 40,451 | 100% |
Country of birth

Languages
The most common main languages spoken in Luton according to the 2011 census are shown in the following table. [12]
| Rank | Language | Usual residents aged 3+ | Proportion |
|---|---|---|---|
| 1 | English | 153,463 | 79.43% |
| 2 | Urdu | 8,567 | 4.43% |
| 3 | Polish | 8,006 | 4.14% |
| 4 | Bengali | 6,337 | 3.28% |
| 5 | Punjabi | 2,203 | 1.14% |
| 6 | Gujarati | 1,714 | 0.89% |
| 7 | Arabic | 1,037 | 0.54% |
| 8 | Lithuanian | 698 | 0.36% |
| 9 | Tamil | 653 | 0.34% |
| 10 | Tagalog/Filipino | 524 | 0.27% |
| 11 | Shona | 489 | 0.25% |
| 12 | Hindi | 484 | 0.25% |
| 13 | French | 439 | 0.23% |
| 14 | Portuguese | 397 | 0.21% |
| 15 | Slovak | 352 | 0.18% |
| 16 | Italian | 342 | 0.18% |
| 17 | Romanian | 340 | 0.18% |
| 18 | Russian | 324 | 0.17% |
| 19 | Malayalam | 316 | 0.16% |
| 20 | Pashto | 293 | 0.15% |
| Other | 6,217 | 3.22% |
Religion

The following table shows the religion of respondents in the 2001, 2011 and 2021 censuses in Luton.
| Religion | 2001 [13] | 2011 [14] | 2021 [15] | |||
|---|---|---|---|---|---|---|
| Number | % | Number | % | Number | % | |
| Christian | 109,973 | 59.65% | 96,271 | 47.38% | 85,297 | 37.87% |
| Buddhist | 456 | 0.25% | 652 | 0.32% | 664 | 0.3% |
| Hindu | 5,025 | 2.73% | 6,749 | 3.32% | 7,438 | 3.30% |
| Jewish | 534 | 0.29% | 326 | 0.16% | 246 | 0.1% |
| Muslim | 26,963 | 14.62% | 49,991 | 24.60% | 74,191 | 32.94% |
| Sikh | 1,487 | 0.81% | 2,347 | 1.16% | 3,032 | 1.35% |
| Other religion | 642 | 0.35% | 898 | 0.44% | 1,115 | 0.5% |
| No religion | 25,960 | 14.08% | 33,594 | 16.53% | 39,580 | 17.57% |
| Religion not stated | 13,331 | 7.23% | 12,373 | 6.09% | 13,697 | 6.08% |
| Total | 184,371 | 100.00% | 203,201 | 100.00% | 225,262 | 100.0 |
Distribution
Distribution of religions according to the 2011 census in Luton
-
 Christianity
 -
 Islam
Islam -
 Judaism
 -
 Hinduism
 -
 Sikhism
 -
 Buddhism
 -
 Other religion
 -
 No religion


See also
- Demographics of the United Kingdom
- Demographics of England
- Demographics of London
- Demographics of Birmingham
- Demographics of Greater Manchester
- List of English cities by population
- List of English districts by population
- List of English districts and their ethnic composition
- List of English districts by area
- List of English districts by population density
References
- ^ "LUTON BOROUGH PROFILE 2011 CENSUS DATA" (PDF).
- ^ a b "Local Authority by Ethnic Group". Office for National Statistics. Retrieved 20 February 2013.
- ^ Philipson, Alice (10 January 2013). "White Britons a minority in Leicester, Luton and Slough". Telegraph. Retrieved 17 March 2013.
- ^ Jones, P. N. (1978). "The Distribution and Diffusion of the Coloured Population in England and Wales, 1961-71". Transactions of the Institute of British Geographers. 3 (4): 515–532. Bibcode: 1978TrIBG...3..515J. doi: 10.2307/622127. ISSN 0020-2754. JSTOR 622127.
- ^ Equality, Commission for Racial (1985). "Ethnic minorities in Britain: statistical information on the pattern of settlement". Commission for Racial Equality: Table 2.2.
- ^ Data is taken from United Kingdom Casweb Data services of the United Kingdom 1991 Census on Ethnic Data for England, Scotland and Wales (Table 6)
- ^ "Office of National Statistics; 2001 Census Key Statistics". webarchive.nationalarchives.gov.uk. Retrieved 7 September 2021.
- ^ "2011 Census: Ethnic Group, local authorities in England and Wales". webarchive.nationalarchives.gov.uk. Retrieved 15 December 2021.
- ^ "Ethnic group - Office for National Statistics". www.ons.gov.uk. Retrieved 29 November 2022.
- ^ "School and pupil characteristics". webarchive.nationalarchives.gov.uk. Retrieved 8 November 2022.
- ^ "Schools, pupils and their characteristics, Academic Year 2021/22". explore-education-statistics.service.gov.uk. Retrieved 9 September 2022.
- ^ "Download:local authorities: county / unitary". NOMIS. Retrieved 17 June 2015.
- ^ "2001 census - theme tables". Retrieved 17 June 2015.
- ^ "Download:local authorities: county / unitary". NOMIS. Retrieved 17 June 2015.
- ^ "Religion - Religion by local authorities, ONS".