| |||||||||||||||||||||
| |||||||||||||||||||||
 County results Westly: 40–50% 50–60% 60–70% McClintock: 40–50% 50–60% 60–70% | |||||||||||||||||||||
| |||||||||||||||||||||
| Elections in California |
|---|
 |
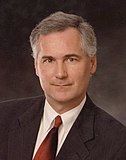
The 2002 California State Controller election was on November 5, 2002. The primary elections took place on March 5, 2002. Businessman Steve Westly, the Democratic nominee, narrowly defeated the Republican nominee, Senator Tom McClintock, for the office previously held by Kathleen Connell, who was term-limited.
Primary results
A bar graph of statewide results in this contest are available at https://web.archive.org/web/20080905210455/http://primary2002.ss.ca.gov/Returns/ctl/00.htm.
Results by county are available here and here.
Democratic
Candidates
Steve Westly, Venture Capitalist
Johan Klehs, Member of The State Board of Equalization
| Candidate | Votes | % | |
|---|---|---|---|
| Steve Westly | 1,137,396 | 56.51 | |
| Johan Klehs | 875,463 | 43.49 | |
| Total votes | 2,012,859 | 100.00 | |
Republican
Candidates
Tom McClintock, State Senator, nominee for CA-24 in 1992 and nominee for Controller in 1994
Dean Andal, Former Assemblyman
W. Snow Hume
Nancy Beecham
| Candidate | Votes | % | |
|---|---|---|---|
| Tom McClintock | 948,539 | 45.73 | |
| Dean Andal | 736,317 | 35.50 | |
| W. Snow Hume | 194,883 | 9.40 | |
| Nancy Beecham | 194,583 | 9.38 | |
| Total votes | 2,074,322 | 100.00 | |
Green
| Candidate | Votes | % | |
|---|---|---|---|
| Laura Wells | 29,457 | 84.12 | |
| David Delano Blanco | 5,561 | 15.88 | |
| Total votes | 35,018 | 100.00 | |
Others
| Party | Candidate | Votes | % | |
|---|---|---|---|---|
| American Independent | Ernest F. Vance | 25,677 | 100.00 | |
| Natural Law | J. Carlos Aguirre | 4,464 | 100.00 | |
Results
| Party | Candidate | Votes | % | |
|---|---|---|---|---|
| Democratic | Steve Westly | 3,289,839 | 45.32 | |
| Republican | Tom McClintock | 3,273,028 | 45.09 | |
| Green | Laura Wells | 419,873 | 5.78 | |
| Natural Law | J. Carlos Aguirre | 179,999 | 2.48 | |
| American Independent | Ernest F. Vance | 96,019 | 1.32 | |
| Invalid or blank votes | 480,063 | 6.20 | ||
| Total votes | 7,258,758 | 100.00 | ||
| Turnout | {{{votes}}} | 36.05 | ||
| Democratic hold | ||||
Results by county
Results from the Secretary of State of California: [1]
| County | Westly | Votes | McClintock | Votes | Wells | Votes | Aguirre | Votes | Vance | Votes |
|---|---|---|---|---|---|---|---|---|---|---|
| San Francisco | 64.26% | 129,048 | 22.26% | 44,700 | 10.52% | 21,124 | 2.17% | 4,357 | 0.79% | 1,579 |
| Alameda | 59.36% | 196,859 | 28.37% | 94,072 | 9.64% | 31,972 | 1.71% | 5,677 | 0.92% | 3,058 |
| Marin | 54.50% | 47,017 | 34.25% | 29,546 | 9.77% | 8,430 | 0.77% | 661 | 0.71% | 611 |
| Los Angeles | 54.18% | 898,440 | 36.10% | 598,694 | 5.08% | 84,270 | 3.47% | 57,542 | 1.17% | 19,356 |
| Santa Cruz | 53.23% | 40,292 | 30.49% | 23,084 | 12.91% | 9,775 | 2.08% | 1,578 | 1.28% | 972 |
| Santa Clara | 52.76% | 184,012 | 38.03% | 132,638 | 5.98% | 20,866 | 1.99% | 6,946 | 1.23% | 4,280 |
| San Mateo | 52.39% | 87,063 | 37.07% | 61,611 | 7.38% | 12,261 | 2.22% | 3,689 | 0.94% | 1,566 |
| Sonoma | 50.67% | 71,927 | 35.32% | 50,129 | 10.99% | 15,595 | 1.49% | 2,119 | 1.53% | 2,176 |
| Monterey | 49.88% | 42,049 | 40.13% | 33,828 | 5.47% | 4,607 | 3.23% | 2,721 | 1.29% | 1,087 |
| Solano | 49.62% | 43,080 | 41.45% | 35,989 | 5.03% | 4,369 | 2.13% | 1,851 | 1.77% | 1,537 |
| Yolo | 48.92% | 22,004 | 39.07% | 17,571 | 8.46% | 3,807 | 2.27% | 1,019 | 1.28% | 574 |
| Contra Costa | 47.77% | 119,554 | 43.02% | 107,656 | 6.44% | 16,109 | 1.67% | 4,171 | 1.11% | 2,781 |
| Napa | 47.21% | 16,823 | 42.57% | 15,169 | 6.99% | 2,490 | 1.60% | 570 | 1.62% | 579 |
| Lake | 46.33% | 7,283 | 43.49% | 6,836 | 6.76% | 1,063 | 1.58% | 248 | 1.84% | 290 |
| San Benito | 44.98% | 5,402 | 45.24% | 5,433 | 4.84% | 581 | 3.80% | 456 | 1.14% | 137 |
| Mendocino | 44.39% | 10,839 | 35.99% | 8,789 | 16.41% | 4,007 | 1.42% | 346 | 1.80% | 439 |
| Imperial | 44.04% | 9,217 | 41.95% | 8,781 | 4.16% | 871 | 8.33% | 1,744 | 1.51% | 317 |
| Sacramento | 43.72% | 135,970 | 47.11% | 146,538 | 6.03% | 18,769 | 1.77% | 5,502 | 1.37% | 4,255 |
| Merced | 42.56% | 17,025 | 49.52% | 19,809 | 3.28% | 1,312 | 3.21% | 1,286 | 1.43% | 571 |
| Humboldt | 42.45% | 17,661 | 40.00% | 16,645 | 15.43% | 6,420 | 1.16% | 483 | 0.96% | 399 |
| Santa Barbara | 40.84% | 45,146 | 48.66% | 53,799 | 7.01% | 7,751 | 2.32% | 2,561 | 1.18% | 1,300 |
| Alpine | 40.56% | 219 | 42.96% | 232 | 10.93% | 59 | 2.22% | 12 | 3.33% | 18 |
| San Joaquin | 40.42% | 48,617 | 51.12% | 61,490 | 4.21% | 5,065 | 2.77% | 3,330 | 1.48% | 1,775 |
| San Diego | 40.02% | 254,818 | 51.63% | 328,780 | 4.57% | 29,121 | 2.36% | 15,008 | 1.42% | 9,051 |
| Stanislaus | 40.02% | 37,470 | 51.93% | 48,619 | 4.28% | 4,005 | 2.28% | 2,139 | 1.49% | 1,396 |
| Del Norte | 39.70% | 2,596 | 49.99% | 3,269 | 6.32% | 413 | 1.44% | 94 | 2.55% | 167 |
| San Bernardino | 38.76% | 107,444 | 52.25% | 144,853 | 4.17% | 11,560 | 3.15% | 8,731 | 1.68% | 4,650 |
| Riverside | 37.77% | 112,833 | 54.77% | 163,626 | 3.75% | 11,189 | 2.29% | 6,839 | 1.43% | 4,264 |
| Fresno | 37.60% | 57,443 | 54.28% | 82,924 | 4.35% | 6,643 | 2.68% | 4,101 | 1.08% | 1,650 |
| Ventura | 37.43% | 70,613 | 53.74% | 101,384 | 4.68% | 8,821 | 2.81% | 5,297 | 1.34% | 2,524 |
| San Luis Obispo | 36.59% | 29,232 | 53.39% | 42,653 | 7.01% | 5,598 | 1.35% | 1,077 | 1.67% | 1,335 |
| Tuolumne | 36.26% | 6,463 | 55.08% | 9,819 | 5.92% | 1,056 | 1.07% | 190 | 1.67% | 298 |
| Kings | 36.14% | 7,592 | 56.61% | 11,893 | 3.46% | 727 | 2.51% | 527 | 1.28% | 268 |
| Amador | 35.31% | 4,524 | 55.84% | 7,155 | 5.88% | 753 | 1.24% | 159 | 1.74% | 223 |
| Trinity | 34.51% | 1,651 | 52.40% | 2,507 | 8.88% | 425 | 1.46% | 70 | 2.74% | 131 |
| Tehama | 34.41% | 5,186 | 57.44% | 8,656 | 3.80% | 573 | 1.55% | 233 | 2.80% | 422 |
| Butte | 33.96% | 20,391 | 54.23% | 32,564 | 8.32% | 4,996 | 1.59% | 953 | 1.90% | 1,142 |
| Tulare | 33.07% | 20,542 | 59.69% | 37,075 | 3.22% | 2,000 | 2.77% | 1,722 | 1.25% | 776 |
| Mono | 32.97% | 960 | 54.70% | 1,593 | 9.00% | 262 | 1.61% | 47 | 1.72% | 50 |
| Nevada | 32.45% | 12,508 | 54.83% | 21,134 | 9.61% | 3,703 | 1.47% | 566 | 1.65% | 637 |
| Calaveras | 32.36% | 4,794 | 56.52% | 8,374 | 7.45% | 1,103 | 1.35% | 200 | 2.32% | 344 |
| Madera | 32.39% | 8,340 | 60.29% | 15,524 | 3.84% | 988 | 2.09% | 538 | 1.39% | 359 |
| Yuba | 32.23% | 3,656 | 58.84% | 6,674 | 4.59% | 521 | 2.00% | 227 | 2.34% | 265 |
| Shasta | 32.12% | 15,456 | 60.54% | 29,135 | 3.92% | 1,886 | 1.10% | 531 | 2.31% | 1,114 |
| Kern | 31.71% | 42,263 | 59.98% | 79,936 | 3.25% | 4,336 | 3.02% | 4,030 | 2.04% | 2,715 |
| Orange | 31.78% | 197,416 | 60.15% | 373,701 | 4.23% | 26,292 | 2.41% | 14,978 | 1.43% | 8,867 |
| Plumas | 31.69% | 2,456 | 58.01% | 4,495 | 6.36% | 493 | 1.74% | 135 | 2.19% | 170 |
| Placer | 31.34% | 29,701 | 61.62% | 58,396 | 4.88% | 4,626 | 0.98% | 932 | 1.17% | 1,106 |
| Siskiyou | 31.30% | 4,741 | 59.01% | 8,937 | 5.45% | 826 | 1.58% | 240 | 2.65% | 401 |
| El Dorado | 31.25% | 16,934 | 60.15% | 32,598 | 5.86% | 3,175 | 1.14% | 618 | 1.60% | 867 |
| Inyo | 31.13% | 1,905 | 59.49% | 3,641 | 5.59% | 342 | 1.62% | 99 | 2.17% | 133 |
| Mariposa | 30.71% | 1,952 | 59.29% | 3,769 | 6.89% | 438 | 1.18% | 75 | 1.93% | 123 |
| Lassen | 30.43% | 2,312 | 61.19% | 4,649 | 4.11% | 312 | 1.42% | 108 | 2.86% | 217 |
| Sierra | 30.04% | 419 | 57.99% | 809 | 6.16% | 86 | 2.08% | 29 | 3.73% | 52 |
| Sutter | 30.06% | 5,629 | 63.20% | 11,834 | 3.07% | 574 | 1.99% | 373 | 1.68% | 314 |
| Colusa | 29.75% | 1,322 | 63.22% | 2,809 | 3.04% | 135 | 2.09% | 93 | 1.89% | 84 |
| Glenn | 29.26% | 1,863 | 63.37% | 4,035 | 3.00% | 191 | 2.12% | 135 | 2.25% | 143 |
| Modoc | 26.22% | 867 | 65.59% | 2,169 | 3.96% | 131 | 1.09% | 36 | 3.14% | 104 |
See also
References
- ^ a b "Secretary of State" (PDF). Secretary of State of California. December 16, 2002. Archived from the original (PDF) on July 31, 2008. Retrieved July 29, 2008.
- ^ "Registration and Participation" (PDF). Secretary of State of California. December 18, 2002. Archived from the original (PDF) on July 31, 2008. Retrieved July 29, 2008.


