| |||||||||||||||||
| |||||||||||||||||
| |||||||||||||||||
| |||||||||||||||||
| Elections in Florida |
|---|
 |
|
|
The 1892 Florida gubernatorial election was held on October 4, 1892. [1] [2] Democratic nominee Henry L. Mitchell defeated People's Party nominee Alonzo P. Baskin with 78.70% of the vote.
General election
Candidates
Major party candidates
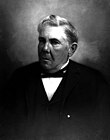
- Henry L. Mitchell, Democratic, Florida Supreme Court Justice and former State Representative. [3]
Other candidates
- Alonzo P. Baskin (People's), former member of the Florida House of Representatives. [4]
- N. J. Hawley, Prohibition
Results
| Party | Candidate | Votes | % | ±% | |
|---|---|---|---|---|---|
| Democratic | Henry L. Mitchell | 32,064 | 78.70% | ||
| Populist | Alonzo P. Baskin | 8,379 | 20.57% | ||
| Prohibition | N. J. Hawley | 297 | 0.73% | ||
| Majority | 23,685 | ||||
| Turnout | |||||
| Democratic hold | Swing | ||||
Results by County
| County [6] | Henry L. Mitchell Democratic |
Alonzo P. Baskin Populist |
N. J. Hawley Prohibition |
Total votes | |||
|---|---|---|---|---|---|---|---|
| # | % | # | % | # | % | ||
| Alachua | 1,502 | 81.72% | 304 | 16.54% | 32 | 1.74% | 1,838 |
| Baker | 187 | 48.20% | 201 | 51.79% | 0 | 0.00% | 388 |
| Bradford | 668 | 69.87% | 288 | 30.13% | 0 | 0.00% | 956 |
| Brevard | 441 | 92.45% | 27 | 5.66% | 9 | 1.89% | 477 |
| Calhoun | 172 | 47.38% | 188 | 51.79% | 3 | 0.83% | 363 |
| Citrus | 308 | 70.64% | 127 | 29.13% | 1 | 0.23% | 436 |
| Clay | 438 | 75.26% | 142 | 24.40% | 2 | 0.34% | 582 |
| Columbia | 755 | 84.36% | 140 | 15.64% | 0 | 0.00% | 895 |
| Dade | 171 | 95.53% | 0 | 0.00% | 8 | 4.47% | 179 |
| DeSoto | 629 | 56.41% | 484 | 43.41% | 2 | 0.18% | 1,115 |
| Duval | 1,645 | 92.89% | 120 | 6.78% | 6 | 0.34% | 1,771 |
| Escambia | 2,103 | 95.20% | 106 | 4.80% | 0 | 0.00% | 2,209 |
| Franklin | 268 | 85.08% | 47 | 14.92% | 0 | 0.00% | 315 |
| Gadsden | 568 | 78.13% | 154 | 21.18% | 5 | 0.69% | 727 |
| Hamilton | 628 | 71.85% | 246 | 28.15% | 0 | 0.00% | 874 |
| Hernando | 279 | 77.29% | 81 | 22.44% | 1 | 0.28% | 361 |
| Hillsborough | 2,849 | 89.90% | 271 | 8.55% | 49 | 1.55% | 3,169 |
| Holmes | 318 | 54.83% | 262 | 45.17% | 0 | 0.00% | 580 |
| Jackson | 1,167 | 89.98% | 130 | 10.02% | 0 | 0.00% | 1,297 |
| Jefferson | 2,425 | 100.00% | 0 | 0.00% | 0 | 0.00% | 2,425 |
| Lafayette | 367 | 73.99% | 129 | 26.01% | 0 | 0.00% | 496 |
| Lake | 1,064 | 82.80% | 169 | 13.15% | 52 | 4.05% | 1,285 |
| Lee | 192 | 96.97% | 6 | 3.03% | 0 | 0.00% | 198 |
| Leon | 1,492 | 100.00% | 0 | 0.00% | 0 | 0.00% | 1,492 |
| Levy | 463 | 66.05% | 237 | 33.81% | 1 | 0.14% | 701 |
| Liberty | 124 | 47.51% | 137 | 52.49% | 0 | 0.00% | 261 |
| Madison | 710 | 92.45% | 57 | 7.42% | 1 | 0.13% | 768 |
| Manatee | 325 | 55.65% | 255 | 43.66% | 4 | 0.68% | 584 |
| Marion | 1,145 | 64.87% | 611 | 34.62% | 9 | 0.51% | 1,765 |
| Monroe | 430 | 71.67% | 157 | 26.17% | 13 | 2.17% | 600 |
| Nassau | 706 | 91.81% | 63 | 8.19% | 0 | 0.00% | 769 |
| Orange | 1,291 | 92.41% | 64 | 4.58% | 42 | 3.01% | 1,397 |
| Osceola | 211 | 90.17% | 23 | 9.83% | 0 | 0.00% | 234 |
| Pasco | 475 | 70.16% | 200 | 29.54% | 2 | 0.30% | 677 |
| Polk | 770 | 56.53% | 577 | 42.36% | 15 | 1.10% | 1,362 |
| Putnam | 888 | 77.42% | 221 | 19.27% | 38 | 3.31% | 1,147 |
| Santa Rosa | 435 | 66.92% | 215 | 33.08% | 0 | 0.00% | 650 |
| St. Johns | 586 | 93.31% | 42 | 6.69% | 0 | 0.00% | 628 |
| Sumter | 450 | 54.61% | 372 | 45.15% | 2 | 0.24% | 824 |
| Suwannee | 656 | 71.38% | 263 | 28.62% | 0 | 0.00% | 919 |
| Taylor | 162 | 41.54% | 228 | 58.46% | 0 | 0.00% | 390 |
| Volusia | 808 | 83.99% | 149 | 15.49% | 5 | 0.52% | 962 |
| Wakulla | 178 | 54.10% | 151 | 45.90% | 0 | 0.00% | 329 |
| Walton | 325 | 46.23% | 375 | 53.34% | 3 | 0.17% | 703 |
| Washington | 290 | 49.91% | 290 | 49.91% | 1 | 0.17% | 581 |
| Actual Totals | 32,064 | 78.82% | 8,309 | 20.43% | 306 | 0.75% | 40,679 |
| Official Totals | 32,064 | 78.84% | 8,309 | 20.43% | 297 | 0.73% | 40,670 |
References
- ^ Mead III, James Andrew (1971). "The Conservative Press And The Campaign". The Populist Party In Florida (PDF) (Master of Arts). Boca Raton, Florida: Florida Atlantic University. p. 64. Retrieved November 27, 2020.
- ^ "Florida Election". The record-union. Sacramento, Calif. October 5, 1892. p. 1. Retrieved November 27, 2020.
- ^ People of Lawmaking in Florida
- ^ Takacs, Jeff, ed. (February 1, 2019). The People of Lawmaking in Florida 1822 - 2019 (PDF). Florida House of Representatives. Retrieved September 5, 2022.
- ^ McGovern, Bernie (2007). Florida Almanac 2007-2008. Pelican. ISBN 9781455604418. Retrieved August 19, 2020.
- ^ Dubin, Michael J. (2010). United States Gubernatorial Elections, 1861-1911: The Official Results by State and County. McFarland. p. 99. ISBN 9780786447220.


