|
| ||||||||||||||||||||||||||
| ||||||||||||||||||||||||||
| ||||||||||||||||||||||||||
 County Results
| ||||||||||||||||||||||||||
| ||||||||||||||||||||||||||
| Elections in Maryland |
|---|
 |
|
|
The 1884 United States presidential election in Maryland took place on November 4, 1884, as part of the 1884 United States presidential election. Voters chose eight representatives, or electors to the Electoral College, who voted for president and vice president.
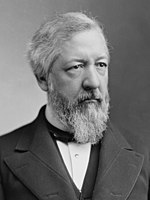
Maryland voted for the Democratic nominee, Grover Cleveland, over the Republican nominee, James G. Blaine. by a margin of 5.98%. [1]
In this election, Maryland voted 5.41% more Democratic than the nation at-large. [2]
Results
| 1884 United States presidential election in Maryland [3] | ||||||||
|---|---|---|---|---|---|---|---|---|
| Party | Candidate | Running mate | Popular vote | Electoral vote | ||||
| Count | % | Count | % | |||||
| Democratic | Grover Cleveland of New York | Thomas Andrews Hendricks of Indiana | 96,866 | 52.07% | 8 | 100.00% | ||
| Republican | James Gillespie Blaine of Maryland | John Alexander Logan of Illinois | 85,748 | 46.10% | 0 | 0.00% | ||
| Prohibition | John Pierce St. John of Kansas | William Daniel of Maryland | 2,827 | 1.52% | 0 | 0.00% | ||
| Greenback | Benjamin Franklin Butler of Massachusetts | Absolom Madden West of Mississippi | 578 | 0.31% | 0 | 0.00% | ||
| Total | 186,019 | 100.00% | 8 | 100.00% | ||||
Results by county
| County | Grover Cleveland
Democratic |
James Gillespie Blaine
Republican |
John Pierce St. John
Prohibition |
Benjamin Franklin Butler | Margin | Total
Votes Cast [4] | |||||
|---|---|---|---|---|---|---|---|---|---|---|---|
| # | % | # | % | # | % | # | % | # | % | ||
| Allegany | 2880 | 43.20% | 3328 | 49.92% | 195 | 2.93% | 263 | 3.95% | -448 | -6.72% | 6666 |
| Anne Arundel | 3052 | 51.77% | 2813 | 47.72% | 30 | 0.51% | 0 | 0.00% | 239 | 4.05% | 5895 |
| Baltimore (City) | 34374 | 54.21% | 27578 | 43.49% | 1273 | 2.01% | 188 | 0.30% | 6796 | 10.72% | 63.413 |
| Baltimore (County) | 7856 | 54.70% | 6257 | 43.57% | 227 | 1.58% | 21 | 0.15% | 1599 | 11.13% | 14361 |
| Calvert | 926 | 44.89% | 1093 | 52.98% | 8 | 0.39% | 36 | 1.75% | -167 | -8.10% | 2063 |
| Caroline | 1432 | 49.81% | 1398 | 48.63% | 43 | 1.50% | 2 | 0.07% | 34 | 1.18% | 2875 |
| Carroll | 3589 | 52.39% | 3206 | 46.80% | 51 | 0.74% | 4 | 0.06% | 383 | 5.59% | 6850 |
| Cecil | 2901 | 51.43% | 2669 | 47.31% | 68 | 1.21% | 3 | 0.05% | 232 | 4.11% | 5641 |
| Charles | 1566 | 46.00% | 1825 | 53.61% | 12 | 0.35% | 1 | 0.03% | -259 | -7.61% | 3404 |
| Dorchester | 2230 | 47.67% | 2396 | 51.22% | 52 | 1.11% | 0 | 0.00% | -166 | -3.55% | 4678 |
| Frederick | 5204 | 47.89% | 5497 | 50.59% | 157 | 1.44% | 8 | 0.07% | -293 | -2.70% | 10866 |
| Garrett | 1172 | 45.15% | 1369 | 52.73% | 22 | 1.27% | 33 | 0.85% | -197 | -7.59% | 2596 |
| Harford | 3240 | 54.99% | 2593 | 44.01% | 56 | 0.95% | 3 | 0.05% | 647 | 10.98% | 5892 |
| Howard | 1733 | 55.03% | 1392 | 44.20% | 23 | 0.73% | 1 | 0.03% | 341 | 10.83% | 3149 |
| Kent | 2152 | 50.67% | 2048 | % | 46 | 1.08% | 1 | 0.02% | 104 | 2.45% | 4247 |
| Montgomery | 3145 | 54.86% | 2495 | 43.52% | 93 | 1.62% | 0 | 0.00% | 650 | 11.34% | 5733 |
| Prince George's | 2971 | 50.73% | 2850 | 48.67% | 31 | 0.53% | 4 | 0.07% | 121 | 2.07% | 5856 |
| Queen Anne's | 2344 | 57.18% | 1710 | 41.72% | 45 | 1.10% | 0 | 0.00% | 634 | 15.47% | 4099 |
| St. Mary's | 1540 | 46.16% | 1773 | 53.15% | 23 | 0.69% | 0 | 0.00% | -233 | -6.98% | 3336 |
| Somerset | 1734 | 45.57% | 2022 | 53.14% | 48 | 1.26% | 1 | 0.03% | -288 | -7.57% | 3805 |
| Talbot | 2214 | 49.62% | 2207 | 49.46% | 39 | 0.87% | 2 | 0.04% | 7 | 0.16% | 4462 |
| Washington | 4189 | 48.57% | 4390 | 50.90% | 44 | 0.51% | 2 | 0.02% | -201 | -2.33% | 8625 |
| Wicomico | 2262 | 61.45% | 1354 | 36.78% | 65 | 1.77% | 0 | 0.00% | 908 | 24.67% | 3681 |
| Worcester | 2231 | 57.44% | 1474 | 37.95% | 176 | 2.01% | 3 | 0.30% | 757 | 19.49% | 3884 |
| Total | 96866 | 52.07% | 85748 | 46.10% | 2827 | 1.52% | 578 | 0.31% | 11118 | 5.97% | 186019 |
Counties that flipped from Democratic to Republican
See also
- United States presidential elections in Maryland
- 1884 United States presidential election
- 1884 United States elections
References
- ^ Humanities, National Endowment for the (November 19, 1884). "Evening capital. (Annapolis, Md.) 1884-1910, November 19, 1884, Image 1". ISSN 2643-8593. Retrieved November 29, 2021.
- ^ "Dave Leip's Atlas of U.S. Presidential Elections". uselectionatlas.org. Retrieved March 31, 2023.
- ^ "1884 Presidential General Election Results – Maryland".
- ^ "County Project (WIP)". Google Docs. Retrieved November 1, 2022.


